Native/Alaskan vs Afghan Unemployment Among Youth under 25 years
COMPARE
Native/Alaskan
Afghan
Unemployment Among Youth under 25 years
Unemployment Among Youth under 25 years Comparison
Natives/Alaskans
Afghans
14.5%
UNEMPLOYMENT AMONG YOUTH UNDER 25 YEARS
0.0/ 100
METRIC RATING
316th/ 347
METRIC RANK
11.3%
UNEMPLOYMENT AMONG YOUTH UNDER 25 YEARS
89.7/ 100
METRIC RATING
118th/ 347
METRIC RANK
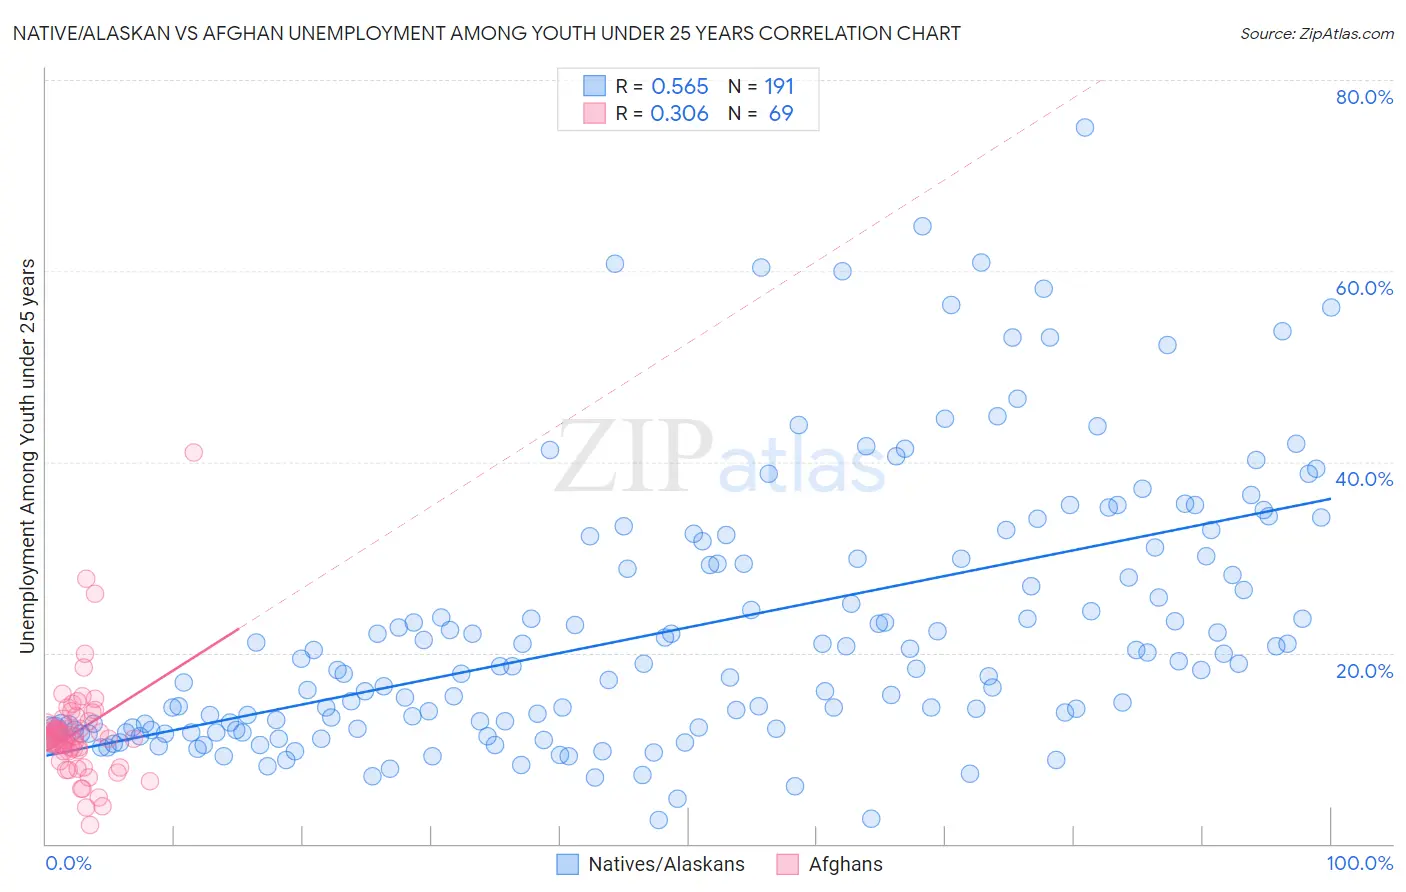
Native/Alaskan vs Afghan Unemployment Among Youth under 25 years Correlation Chart
The statistical analysis conducted on geographies consisting of 499,955,356 people shows a substantial positive correlation between the proportion of Natives/Alaskans and unemployment rate among youth under the age of 25 in the United States with a correlation coefficient (R) of 0.565 and weighted average of 14.5%. Similarly, the statistical analysis conducted on geographies consisting of 148,562,433 people shows a mild positive correlation between the proportion of Afghans and unemployment rate among youth under the age of 25 in the United States with a correlation coefficient (R) of 0.306 and weighted average of 11.3%, a difference of 27.5%.
Unemployment Among Youth under 25 years Correlation Summary
| Measurement | Native/Alaskan | Afghan |
| Minimum | 2.4% | 1.9% |
| Maximum | 75.0% | 41.0% |
| Range | 72.6% | 39.1% |
| Mean | 22.6% | 11.7% |
| Median | 18.5% | 11.1% |
| Interquartile 25% (IQ1) | 12.0% | 9.8% |
| Interquartile 75% (IQ3) | 29.9% | 12.6% |
| Interquartile Range (IQR) | 17.9% | 2.8% |
| Standard Deviation (Sample) | 14.0% | 5.5% |
| Standard Deviation (Population) | 14.0% | 5.5% |
Similar Demographics by Unemployment Among Youth under 25 years
Demographics Similar to Natives/Alaskans by Unemployment Among Youth under 25 years
In terms of unemployment among youth under 25 years, the demographic groups most similar to Natives/Alaskans are Black/African American (14.5%, a difference of 0.090%), Sioux (14.4%, a difference of 0.42%), Jamaican (14.4%, a difference of 0.54%), Immigrants from Armenia (14.4%, a difference of 0.63%), and Immigrants from Dominica (14.6%, a difference of 0.80%).
| Demographics | Rating | Rank | Unemployment Among Youth under 25 years |
| Aleuts | 0.0 /100 | #309 | Tragic 14.1% |
| Immigrants | West Indies | 0.0 /100 | #310 | Tragic 14.2% |
| Immigrants | Bangladesh | 0.0 /100 | #311 | Tragic 14.2% |
| Vietnamese | 0.0 /100 | #312 | Tragic 14.3% |
| Immigrants | Armenia | 0.0 /100 | #313 | Tragic 14.4% |
| Jamaicans | 0.0 /100 | #314 | Tragic 14.4% |
| Sioux | 0.0 /100 | #315 | Tragic 14.4% |
| Natives/Alaskans | 0.0 /100 | #316 | Tragic 14.5% |
| Blacks/African Americans | 0.0 /100 | #317 | Tragic 14.5% |
| Immigrants | Dominica | 0.0 /100 | #318 | Tragic 14.6% |
| West Indians | 0.0 /100 | #319 | Tragic 14.6% |
| Barbadians | 0.0 /100 | #320 | Tragic 14.6% |
| Cheyenne | 0.0 /100 | #321 | Tragic 14.6% |
| Trinidadians and Tobagonians | 0.0 /100 | #322 | Tragic 14.6% |
| Immigrants | Trinidad and Tobago | 0.0 /100 | #323 | Tragic 14.6% |
Demographics Similar to Afghans by Unemployment Among Youth under 25 years
In terms of unemployment among youth under 25 years, the demographic groups most similar to Afghans are Burmese (11.3%, a difference of 0.010%), Sri Lankan (11.3%, a difference of 0.010%), Immigrants from Vietnam (11.3%, a difference of 0.020%), Immigrants from Ethiopia (11.3%, a difference of 0.030%), and Immigrants from Scotland (11.4%, a difference of 0.050%).
| Demographics | Rating | Rank | Unemployment Among Youth under 25 years |
| Immigrants | France | 90.3 /100 | #111 | Exceptional 11.3% |
| Immigrants | Austria | 90.3 /100 | #112 | Exceptional 11.3% |
| Fijians | 90.2 /100 | #113 | Exceptional 11.3% |
| Immigrants | Ethiopia | 89.9 /100 | #114 | Excellent 11.3% |
| Immigrants | Vietnam | 89.9 /100 | #115 | Excellent 11.3% |
| Burmese | 89.8 /100 | #116 | Excellent 11.3% |
| Sri Lankans | 89.8 /100 | #117 | Excellent 11.3% |
| Afghans | 89.7 /100 | #118 | Excellent 11.3% |
| Immigrants | Scotland | 89.2 /100 | #119 | Excellent 11.4% |
| Malaysians | 89.0 /100 | #120 | Excellent 11.4% |
| Slovaks | 88.9 /100 | #121 | Excellent 11.4% |
| Immigrants | Micronesia | 88.1 /100 | #122 | Excellent 11.4% |
| Basques | 87.8 /100 | #123 | Excellent 11.4% |
| Italians | 87.2 /100 | #124 | Excellent 11.4% |
| Immigrants | Argentina | 87.2 /100 | #125 | Excellent 11.4% |