Native/Alaskan vs White/Caucasian Unemployment Among Ages 60 to 64 years
COMPARE
Native/Alaskan
White/Caucasian
Unemployment Among Ages 60 to 64 years
Unemployment Among Ages 60 to 64 years Comparison
Natives/Alaskans
Whites/Caucasians
5.7%
UNEMPLOYMENT AMONG AGES 60 TO 64 YEARS
0.0/ 100
METRIC RATING
318th/ 347
METRIC RANK
4.7%
UNEMPLOYMENT AMONG AGES 60 TO 64 YEARS
97.8/ 100
METRIC RATING
103rd/ 347
METRIC RANK
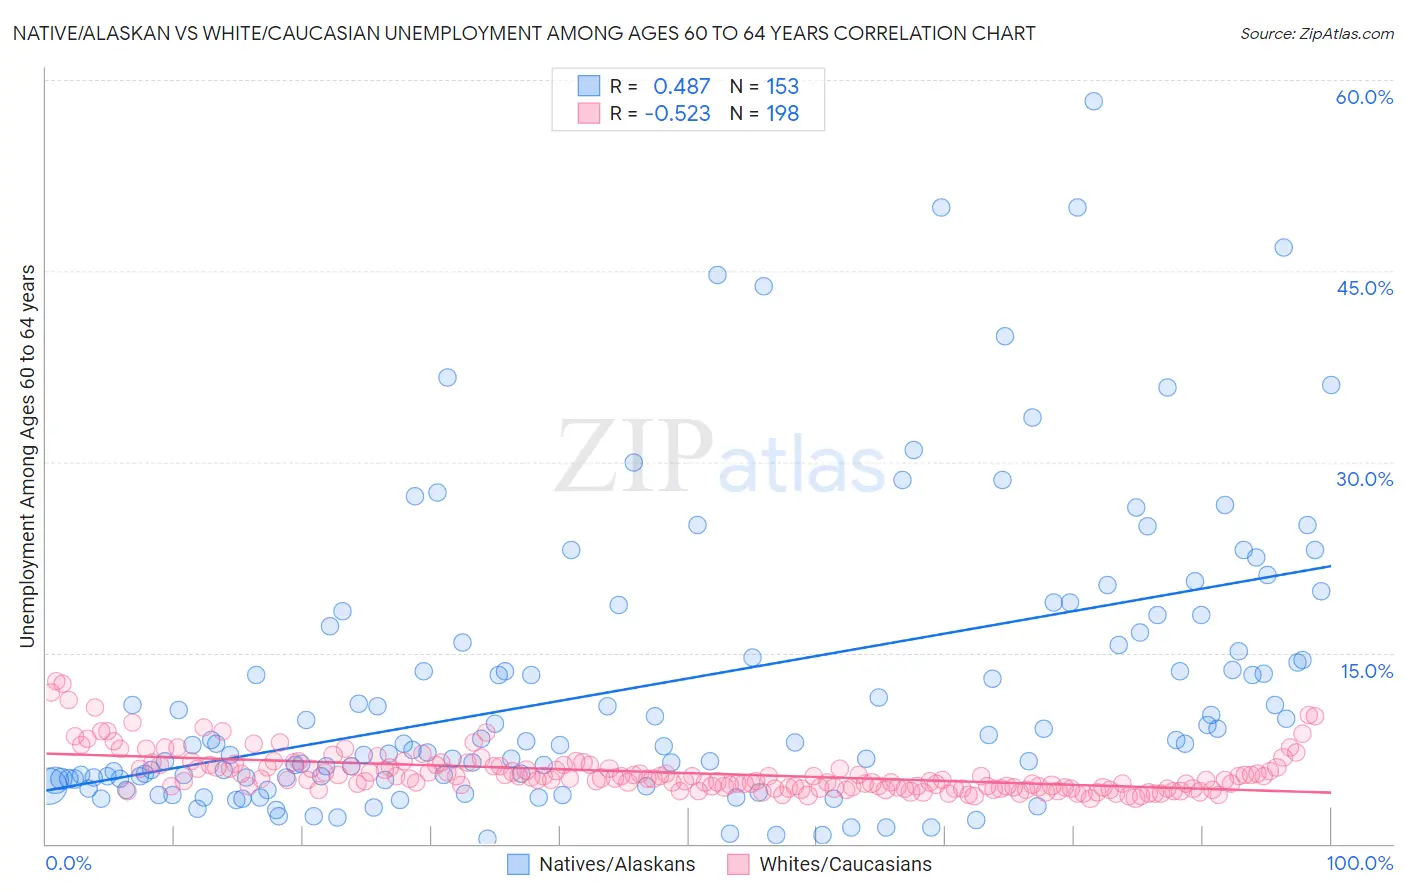
Native/Alaskan vs White/Caucasian Unemployment Among Ages 60 to 64 years Correlation Chart
The statistical analysis conducted on geographies consisting of 437,522,212 people shows a moderate positive correlation between the proportion of Natives/Alaskans and unemployment rate among population between the ages 60 and 64 in the United States with a correlation coefficient (R) of 0.487 and weighted average of 5.7%. Similarly, the statistical analysis conducted on geographies consisting of 469,979,801 people shows a substantial negative correlation between the proportion of Whites/Caucasians and unemployment rate among population between the ages 60 and 64 in the United States with a correlation coefficient (R) of -0.523 and weighted average of 4.7%, a difference of 20.6%.
Unemployment Among Ages 60 to 64 years Correlation Summary
| Measurement | Native/Alaskan | White/Caucasian |
| Minimum | 0.40% | 3.5% |
| Maximum | 58.3% | 12.7% |
| Range | 57.9% | 9.2% |
| Mean | 12.4% | 5.6% |
| Median | 7.9% | 5.1% |
| Interquartile 25% (IQ1) | 5.1% | 4.4% |
| Interquartile 75% (IQ3) | 16.2% | 6.1% |
| Interquartile Range (IQR) | 11.1% | 1.7% |
| Standard Deviation (Sample) | 11.4% | 1.7% |
| Standard Deviation (Population) | 11.3% | 1.7% |
Similar Demographics by Unemployment Among Ages 60 to 64 years
Demographics Similar to Natives/Alaskans by Unemployment Among Ages 60 to 64 years
In terms of unemployment among ages 60 to 64 years, the demographic groups most similar to Natives/Alaskans are Shoshone (5.7%, a difference of 0.050%), Immigrants from Belize (5.7%, a difference of 0.49%), Cheyenne (5.6%, a difference of 0.91%), Colville (5.7%, a difference of 1.3%), and Cree (5.6%, a difference of 1.3%).
| Demographics | Rating | Rank | Unemployment Among Ages 60 to 64 years |
| U.S. Virgin Islanders | 0.0 /100 | #311 | Tragic 5.5% |
| Immigrants | West Indies | 0.0 /100 | #312 | Tragic 5.5% |
| Belizeans | 0.0 /100 | #313 | Tragic 5.5% |
| Guyanese | 0.0 /100 | #314 | Tragic 5.5% |
| Cree | 0.0 /100 | #315 | Tragic 5.6% |
| Cheyenne | 0.0 /100 | #316 | Tragic 5.6% |
| Shoshone | 0.0 /100 | #317 | Tragic 5.7% |
| Natives/Alaskans | 0.0 /100 | #318 | Tragic 5.7% |
| Immigrants | Belize | 0.0 /100 | #319 | Tragic 5.7% |
| Colville | 0.0 /100 | #320 | Tragic 5.7% |
| Dutch West Indians | 0.0 /100 | #321 | Tragic 5.7% |
| Ecuadorians | 0.0 /100 | #322 | Tragic 5.8% |
| Alsatians | 0.0 /100 | #323 | Tragic 5.8% |
| Immigrants | Ecuador | 0.0 /100 | #324 | Tragic 5.8% |
| Paiute | 0.0 /100 | #325 | Tragic 5.8% |
Demographics Similar to Whites/Caucasians by Unemployment Among Ages 60 to 64 years
In terms of unemployment among ages 60 to 64 years, the demographic groups most similar to Whites/Caucasians are Immigrants from Canada (4.7%, a difference of 0.010%), Malaysian (4.7%, a difference of 0.020%), Portuguese (4.7%, a difference of 0.030%), Paraguayan (4.7%, a difference of 0.040%), and Egyptian (4.7%, a difference of 0.060%).
| Demographics | Rating | Rank | Unemployment Among Ages 60 to 64 years |
| Poles | 98.1 /100 | #96 | Exceptional 4.7% |
| Immigrants | Albania | 98.0 /100 | #97 | Exceptional 4.7% |
| Somalis | 98.0 /100 | #98 | Exceptional 4.7% |
| Egyptians | 98.0 /100 | #99 | Exceptional 4.7% |
| Portuguese | 97.9 /100 | #100 | Exceptional 4.7% |
| Malaysians | 97.9 /100 | #101 | Exceptional 4.7% |
| Immigrants | Canada | 97.8 /100 | #102 | Exceptional 4.7% |
| Whites/Caucasians | 97.8 /100 | #103 | Exceptional 4.7% |
| Paraguayans | 97.7 /100 | #104 | Exceptional 4.7% |
| Canadians | 97.7 /100 | #105 | Exceptional 4.7% |
| Immigrants | North America | 97.6 /100 | #106 | Exceptional 4.7% |
| Greeks | 97.5 /100 | #107 | Exceptional 4.7% |
| Immigrants | Japan | 97.4 /100 | #108 | Exceptional 4.7% |
| Immigrants | Netherlands | 97.4 /100 | #109 | Exceptional 4.7% |
| Ethiopians | 97.2 /100 | #110 | Exceptional 4.7% |