Native/Alaskan vs Okinawan Unemployment Among Youth under 25 years
COMPARE
Native/Alaskan
Okinawan
Unemployment Among Youth under 25 years
Unemployment Among Youth under 25 years Comparison
Natives/Alaskans
Okinawans
14.5%
UNEMPLOYMENT AMONG YOUTH UNDER 25 YEARS
0.0/ 100
METRIC RATING
316th/ 347
METRIC RANK
11.6%
UNEMPLOYMENT AMONG YOUTH UNDER 25 YEARS
58.7/ 100
METRIC RATING
167th/ 347
METRIC RANK
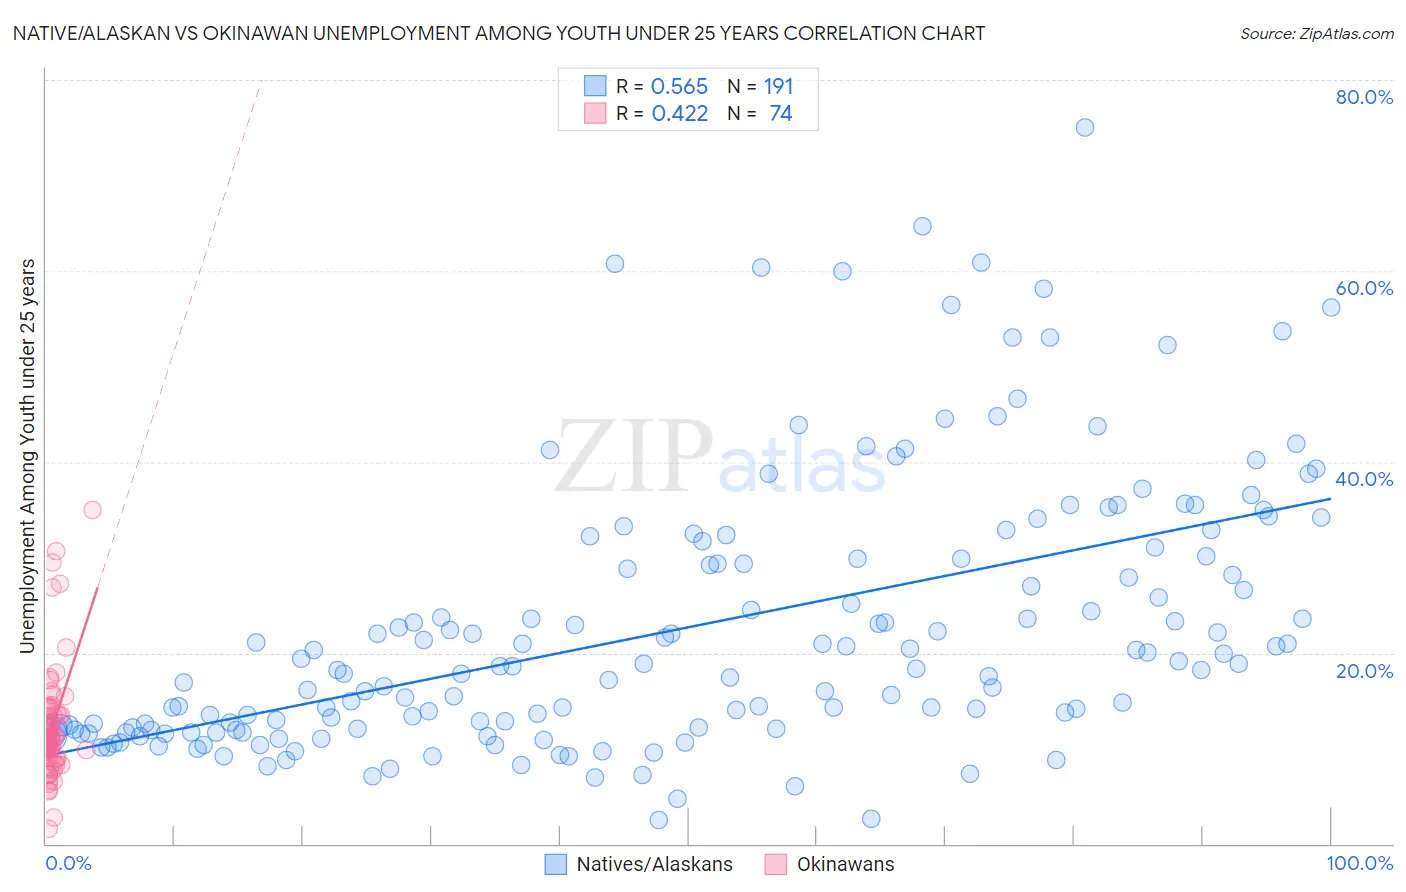
Native/Alaskan vs Okinawan Unemployment Among Youth under 25 years Correlation Chart
The statistical analysis conducted on geographies consisting of 499,955,356 people shows a substantial positive correlation between the proportion of Natives/Alaskans and unemployment rate among youth under the age of 25 in the United States with a correlation coefficient (R) of 0.565 and weighted average of 14.5%. Similarly, the statistical analysis conducted on geographies consisting of 73,716,018 people shows a moderate positive correlation between the proportion of Okinawans and unemployment rate among youth under the age of 25 in the United States with a correlation coefficient (R) of 0.422 and weighted average of 11.6%, a difference of 25.1%.
Unemployment Among Youth under 25 years Correlation Summary
| Measurement | Native/Alaskan | Okinawan |
| Minimum | 2.4% | 1.6% |
| Maximum | 75.0% | 34.9% |
| Range | 72.6% | 33.3% |
| Mean | 22.6% | 12.2% |
| Median | 18.5% | 11.0% |
| Interquartile 25% (IQ1) | 12.0% | 9.0% |
| Interquartile 75% (IQ3) | 29.9% | 13.5% |
| Interquartile Range (IQR) | 17.9% | 4.5% |
| Standard Deviation (Sample) | 14.0% | 5.8% |
| Standard Deviation (Population) | 14.0% | 5.8% |
Similar Demographics by Unemployment Among Youth under 25 years
Demographics Similar to Natives/Alaskans by Unemployment Among Youth under 25 years
In terms of unemployment among youth under 25 years, the demographic groups most similar to Natives/Alaskans are Black/African American (14.5%, a difference of 0.090%), Sioux (14.4%, a difference of 0.42%), Jamaican (14.4%, a difference of 0.54%), Immigrants from Armenia (14.4%, a difference of 0.63%), and Immigrants from Dominica (14.6%, a difference of 0.80%).
| Demographics | Rating | Rank | Unemployment Among Youth under 25 years |
| Aleuts | 0.0 /100 | #309 | Tragic 14.1% |
| Immigrants | West Indies | 0.0 /100 | #310 | Tragic 14.2% |
| Immigrants | Bangladesh | 0.0 /100 | #311 | Tragic 14.2% |
| Vietnamese | 0.0 /100 | #312 | Tragic 14.3% |
| Immigrants | Armenia | 0.0 /100 | #313 | Tragic 14.4% |
| Jamaicans | 0.0 /100 | #314 | Tragic 14.4% |
| Sioux | 0.0 /100 | #315 | Tragic 14.4% |
| Natives/Alaskans | 0.0 /100 | #316 | Tragic 14.5% |
| Blacks/African Americans | 0.0 /100 | #317 | Tragic 14.5% |
| Immigrants | Dominica | 0.0 /100 | #318 | Tragic 14.6% |
| West Indians | 0.0 /100 | #319 | Tragic 14.6% |
| Barbadians | 0.0 /100 | #320 | Tragic 14.6% |
| Cheyenne | 0.0 /100 | #321 | Tragic 14.6% |
| Trinidadians and Tobagonians | 0.0 /100 | #322 | Tragic 14.6% |
| Immigrants | Trinidad and Tobago | 0.0 /100 | #323 | Tragic 14.6% |
Demographics Similar to Okinawans by Unemployment Among Youth under 25 years
In terms of unemployment among youth under 25 years, the demographic groups most similar to Okinawans are Potawatomi (11.6%, a difference of 0.040%), Eastern European (11.6%, a difference of 0.050%), Russian (11.6%, a difference of 0.060%), Spanish (11.6%, a difference of 0.070%), and Immigrants from Sweden (11.5%, a difference of 0.11%).
| Demographics | Rating | Rank | Unemployment Among Youth under 25 years |
| Immigrants | Eastern Asia | 64.5 /100 | #160 | Good 11.5% |
| Ukrainians | 64.3 /100 | #161 | Good 11.5% |
| Immigrants | Northern Africa | 62.7 /100 | #162 | Good 11.5% |
| Immigrants | Kazakhstan | 62.7 /100 | #163 | Good 11.5% |
| Immigrants | Laos | 62.4 /100 | #164 | Good 11.5% |
| Immigrants | Sweden | 61.3 /100 | #165 | Good 11.5% |
| Spanish | 60.3 /100 | #166 | Good 11.6% |
| Okinawans | 58.7 /100 | #167 | Average 11.6% |
| Potawatomi | 57.9 /100 | #168 | Average 11.6% |
| Eastern Europeans | 57.5 /100 | #169 | Average 11.6% |
| Russians | 57.3 /100 | #170 | Average 11.6% |
| Bangladeshis | 55.6 /100 | #171 | Average 11.6% |
| Immigrants | Morocco | 55.1 /100 | #172 | Average 11.6% |
| Immigrants | South Eastern Asia | 51.7 /100 | #173 | Average 11.6% |
| Immigrants | China | 50.0 /100 | #174 | Average 11.6% |