Native/Alaskan vs Egyptian Unemployment Among Seniors over 75 years
COMPARE
Native/Alaskan
Egyptian
Unemployment Among Seniors over 75 years
Unemployment Among Seniors over 75 years Comparison
Natives/Alaskans
Egyptians
10.2%
UNEMPLOYMENT AMONG SENIORS OVER 75 YEARS
0.0/ 100
METRIC RATING
316th/ 347
METRIC RANK
8.1%
UNEMPLOYMENT AMONG SENIORS OVER 75 YEARS
99.5/ 100
METRIC RATING
91st/ 347
METRIC RANK
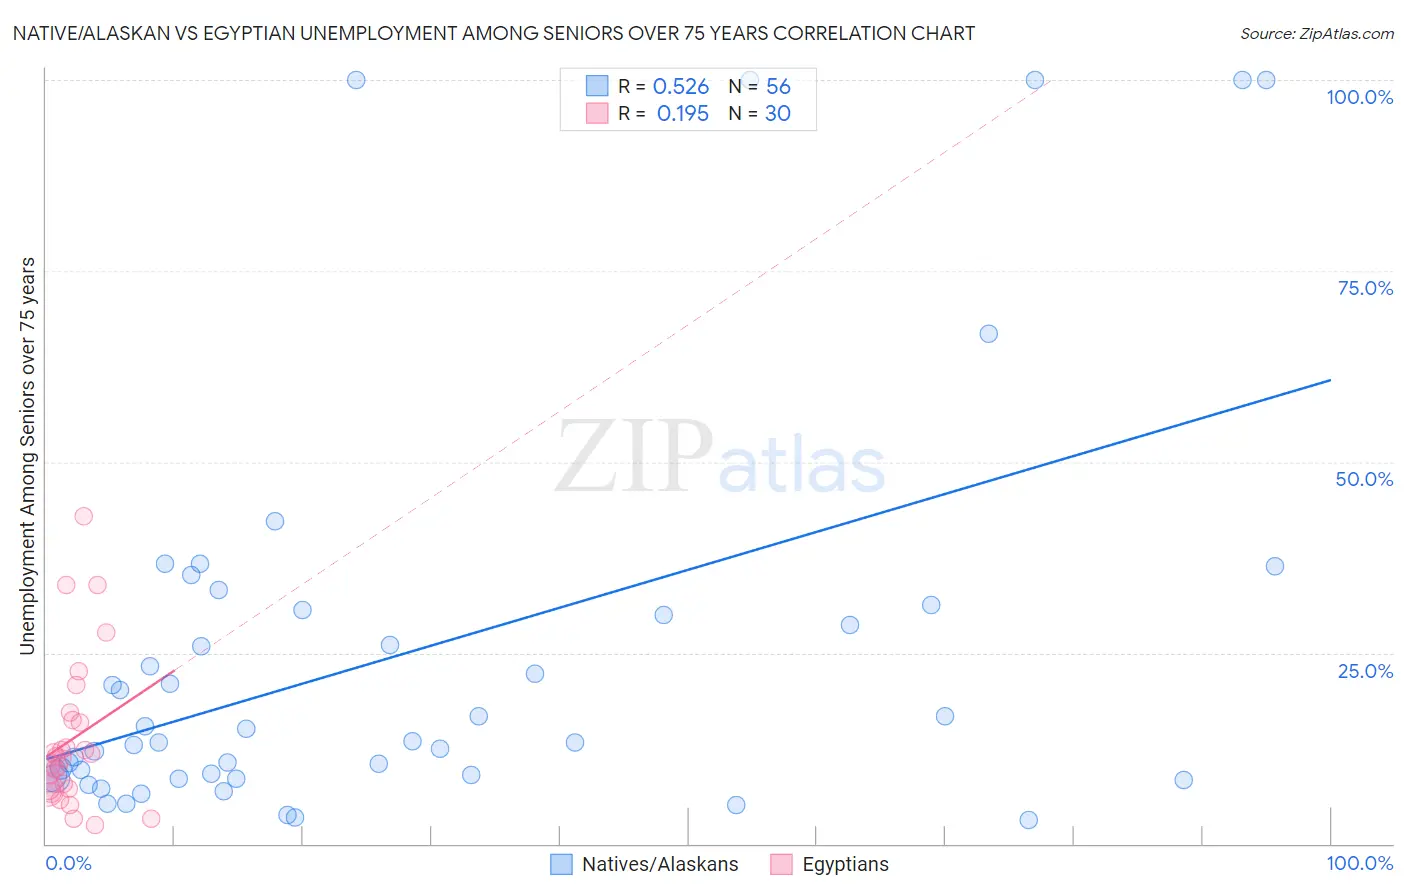
Native/Alaskan vs Egyptian Unemployment Among Seniors over 75 years Correlation Chart
The statistical analysis conducted on geographies consisting of 226,317,213 people shows a substantial positive correlation between the proportion of Natives/Alaskans and unemployment rate among seniors over the age of 75 in the United States with a correlation coefficient (R) of 0.526 and weighted average of 10.2%. Similarly, the statistical analysis conducted on geographies consisting of 164,384,297 people shows a poor positive correlation between the proportion of Egyptians and unemployment rate among seniors over the age of 75 in the United States with a correlation coefficient (R) of 0.195 and weighted average of 8.1%, a difference of 25.4%.
Unemployment Among Seniors over 75 years Correlation Summary
| Measurement | Native/Alaskan | Egyptian |
| Minimum | 3.1% | 2.5% |
| Maximum | 100.0% | 42.9% |
| Range | 96.9% | 40.4% |
| Mean | 24.8% | 13.7% |
| Median | 13.4% | 11.2% |
| Interquartile 25% (IQ1) | 8.8% | 7.3% |
| Interquartile 75% (IQ3) | 30.3% | 16.3% |
| Interquartile Range (IQR) | 21.5% | 9.0% |
| Standard Deviation (Sample) | 26.7% | 9.8% |
| Standard Deviation (Population) | 26.4% | 9.6% |
Similar Demographics by Unemployment Among Seniors over 75 years
Demographics Similar to Natives/Alaskans by Unemployment Among Seniors over 75 years
In terms of unemployment among seniors over 75 years, the demographic groups most similar to Natives/Alaskans are Pennsylvania German (10.2%, a difference of 0.24%), Dutch West Indian (10.2%, a difference of 0.36%), Irish (10.2%, a difference of 0.37%), Liberian (10.2%, a difference of 0.49%), and German (10.3%, a difference of 0.56%).
| Demographics | Rating | Rank | Unemployment Among Seniors over 75 years |
| English | 0.0 /100 | #309 | Tragic 10.1% |
| Hungarians | 0.0 /100 | #310 | Tragic 10.1% |
| Scottish | 0.0 /100 | #311 | Tragic 10.1% |
| Chippewa | 0.0 /100 | #312 | Tragic 10.1% |
| Nepalese | 0.0 /100 | #313 | Tragic 10.1% |
| Dutch West Indians | 0.0 /100 | #314 | Tragic 10.2% |
| Pennsylvania Germans | 0.0 /100 | #315 | Tragic 10.2% |
| Natives/Alaskans | 0.0 /100 | #316 | Tragic 10.2% |
| Irish | 0.0 /100 | #317 | Tragic 10.2% |
| Liberians | 0.0 /100 | #318 | Tragic 10.2% |
| Germans | 0.0 /100 | #319 | Tragic 10.3% |
| French | 0.0 /100 | #320 | Tragic 10.3% |
| Aleuts | 0.0 /100 | #321 | Tragic 10.3% |
| Poles | 0.0 /100 | #322 | Tragic 10.3% |
| Tongans | 0.0 /100 | #323 | Tragic 10.4% |
Demographics Similar to Egyptians by Unemployment Among Seniors over 75 years
In terms of unemployment among seniors over 75 years, the demographic groups most similar to Egyptians are Venezuelan (8.1%, a difference of 0.0%), Immigrants from Vietnam (8.1%, a difference of 0.040%), Immigrants from Netherlands (8.1%, a difference of 0.090%), Immigrants from Korea (8.1%, a difference of 0.12%), and Immigrants from Ireland (8.1%, a difference of 0.12%).
| Demographics | Rating | Rank | Unemployment Among Seniors over 75 years |
| U.S. Virgin Islanders | 99.7 /100 | #84 | Exceptional 8.1% |
| Immigrants | Indonesia | 99.7 /100 | #85 | Exceptional 8.1% |
| Immigrants | Singapore | 99.7 /100 | #86 | Exceptional 8.1% |
| Basques | 99.5 /100 | #87 | Exceptional 8.1% |
| New Zealanders | 99.5 /100 | #88 | Exceptional 8.1% |
| Immigrants | Korea | 99.5 /100 | #89 | Exceptional 8.1% |
| Immigrants | Vietnam | 99.5 /100 | #90 | Exceptional 8.1% |
| Egyptians | 99.5 /100 | #91 | Exceptional 8.1% |
| Venezuelans | 99.5 /100 | #92 | Exceptional 8.1% |
| Immigrants | Netherlands | 99.5 /100 | #93 | Exceptional 8.1% |
| Immigrants | Ireland | 99.4 /100 | #94 | Exceptional 8.1% |
| Nicaraguans | 99.3 /100 | #95 | Exceptional 8.2% |
| Immigrants | Belgium | 99.3 /100 | #96 | Exceptional 8.2% |
| Immigrants | Sri Lanka | 99.3 /100 | #97 | Exceptional 8.2% |
| Immigrants | Northern Africa | 99.3 /100 | #98 | Exceptional 8.2% |