Tlingit-Haida vs Egyptian Unemployment Among Seniors over 75 years
COMPARE
Tlingit-Haida
Egyptian
Unemployment Among Seniors over 75 years
Unemployment Among Seniors over 75 years Comparison
Tlingit-Haida
Egyptians
20.7%
UNEMPLOYMENT AMONG SENIORS OVER 75 YEARS
0.0/ 100
METRIC RATING
346th/ 347
METRIC RANK
8.1%
UNEMPLOYMENT AMONG SENIORS OVER 75 YEARS
99.5/ 100
METRIC RATING
91st/ 347
METRIC RANK
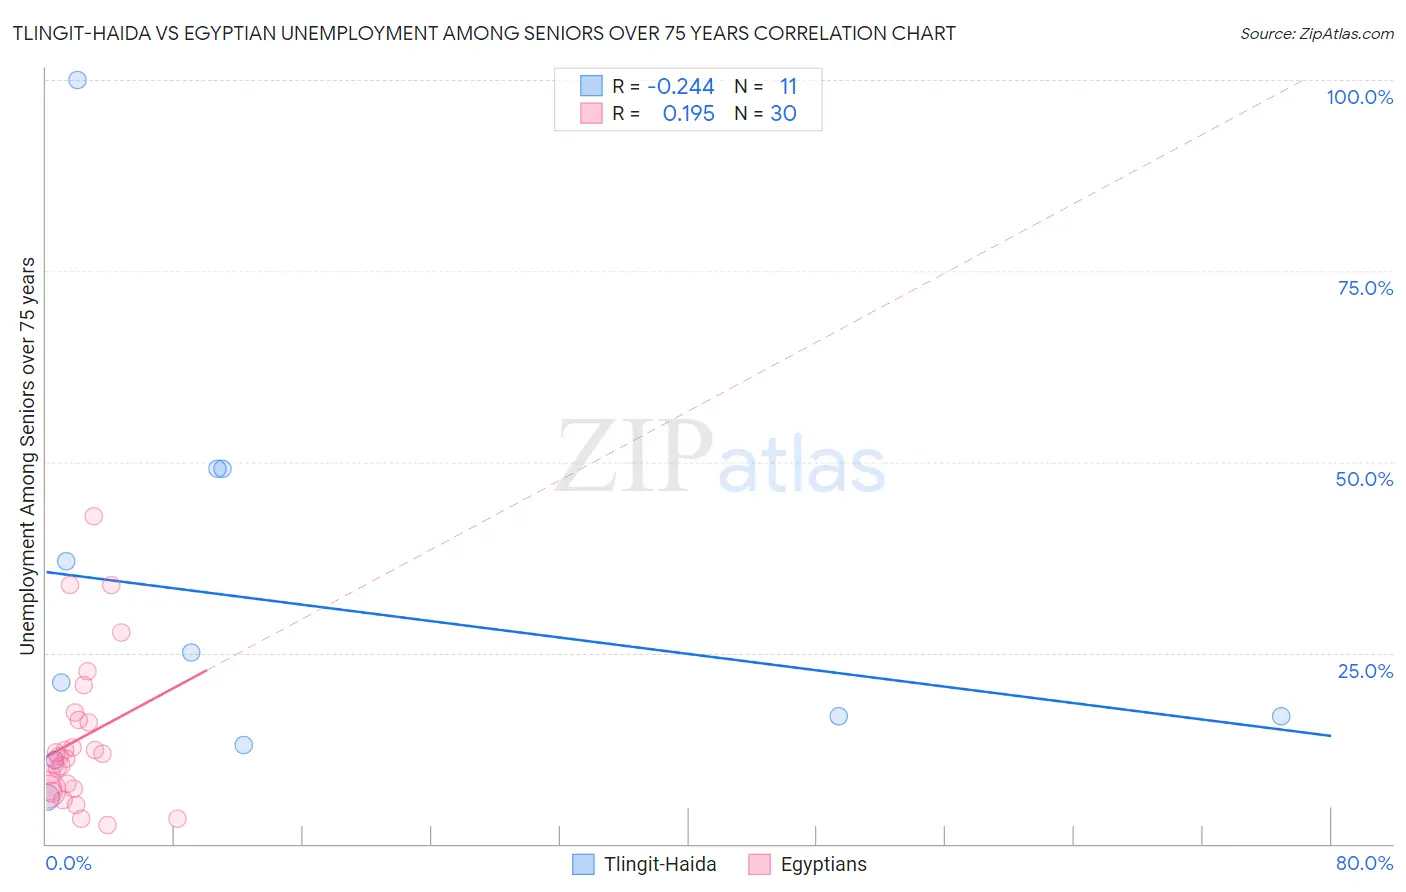
Tlingit-Haida vs Egyptian Unemployment Among Seniors over 75 years Correlation Chart
The statistical analysis conducted on geographies consisting of 44,675,055 people shows a weak negative correlation between the proportion of Tlingit-Haida and unemployment rate among seniors over the age of 75 in the United States with a correlation coefficient (R) of -0.244 and weighted average of 20.7%. Similarly, the statistical analysis conducted on geographies consisting of 164,384,297 people shows a poor positive correlation between the proportion of Egyptians and unemployment rate among seniors over the age of 75 in the United States with a correlation coefficient (R) of 0.195 and weighted average of 8.1%, a difference of 155.1%.
Unemployment Among Seniors over 75 years Correlation Summary
| Measurement | Tlingit-Haida | Egyptian |
| Minimum | 6.1% | 2.5% |
| Maximum | 100.0% | 42.9% |
| Range | 93.9% | 40.4% |
| Mean | 31.3% | 13.7% |
| Median | 21.1% | 11.2% |
| Interquartile 25% (IQ1) | 13.0% | 7.3% |
| Interquartile 75% (IQ3) | 49.1% | 16.3% |
| Interquartile Range (IQR) | 36.1% | 9.0% |
| Standard Deviation (Sample) | 27.1% | 9.8% |
| Standard Deviation (Population) | 25.8% | 9.6% |
Similar Demographics by Unemployment Among Seniors over 75 years
Demographics Similar to Tlingit-Haida by Unemployment Among Seniors over 75 years
In terms of unemployment among seniors over 75 years, the demographic groups most similar to Tlingit-Haida are Yakama (18.4%, a difference of 12.6%), Immigrants from Yemen (16.5%, a difference of 25.8%), Alaska Native (14.7%, a difference of 41.4%), Hmong (13.7%, a difference of 51.0%), and Lumbee (13.5%, a difference of 54.1%).
| Demographics | Rating | Rank | Unemployment Among Seniors over 75 years |
| Alaskan Athabascans | 0.0 /100 | #333 | Tragic 11.0% |
| Assyrians/Chaldeans/Syriacs | 0.0 /100 | #334 | Tragic 11.1% |
| French Canadians | 0.0 /100 | #335 | Tragic 11.2% |
| Immigrants | North Macedonia | 0.0 /100 | #336 | Tragic 11.3% |
| Cape Verdeans | 0.0 /100 | #337 | Tragic 11.4% |
| Immigrants | Cabo Verde | 0.0 /100 | #338 | Tragic 12.3% |
| Cajuns | 0.0 /100 | #339 | Tragic 12.5% |
| Yup'ik | 0.0 /100 | #340 | Tragic 12.8% |
| Lumbee | 0.0 /100 | #341 | Tragic 13.5% |
| Hmong | 0.0 /100 | #342 | Tragic 13.7% |
| Alaska Natives | 0.0 /100 | #343 | Tragic 14.7% |
| Immigrants | Yemen | 0.0 /100 | #344 | Tragic 16.5% |
| Yakama | 0.0 /100 | #345 | Tragic 18.4% |
| Tlingit-Haida | 0.0 /100 | #346 | Tragic 20.7% |
Demographics Similar to Egyptians by Unemployment Among Seniors over 75 years
In terms of unemployment among seniors over 75 years, the demographic groups most similar to Egyptians are Venezuelan (8.1%, a difference of 0.0%), Immigrants from Vietnam (8.1%, a difference of 0.040%), Immigrants from Netherlands (8.1%, a difference of 0.090%), Immigrants from Korea (8.1%, a difference of 0.12%), and Immigrants from Ireland (8.1%, a difference of 0.12%).
| Demographics | Rating | Rank | Unemployment Among Seniors over 75 years |
| U.S. Virgin Islanders | 99.7 /100 | #84 | Exceptional 8.1% |
| Immigrants | Indonesia | 99.7 /100 | #85 | Exceptional 8.1% |
| Immigrants | Singapore | 99.7 /100 | #86 | Exceptional 8.1% |
| Basques | 99.5 /100 | #87 | Exceptional 8.1% |
| New Zealanders | 99.5 /100 | #88 | Exceptional 8.1% |
| Immigrants | Korea | 99.5 /100 | #89 | Exceptional 8.1% |
| Immigrants | Vietnam | 99.5 /100 | #90 | Exceptional 8.1% |
| Egyptians | 99.5 /100 | #91 | Exceptional 8.1% |
| Venezuelans | 99.5 /100 | #92 | Exceptional 8.1% |
| Immigrants | Netherlands | 99.5 /100 | #93 | Exceptional 8.1% |
| Immigrants | Ireland | 99.4 /100 | #94 | Exceptional 8.1% |
| Nicaraguans | 99.3 /100 | #95 | Exceptional 8.2% |
| Immigrants | Belgium | 99.3 /100 | #96 | Exceptional 8.2% |
| Immigrants | Sri Lanka | 99.3 /100 | #97 | Exceptional 8.2% |
| Immigrants | Northern Africa | 99.3 /100 | #98 | Exceptional 8.2% |