Native/Alaskan vs Chilean Unemployment Among Seniors over 75 years
COMPARE
Native/Alaskan
Chilean
Unemployment Among Seniors over 75 years
Unemployment Among Seniors over 75 years Comparison
Natives/Alaskans
Chileans
10.2%
UNEMPLOYMENT AMONG SENIORS OVER 75 YEARS
0.0/ 100
METRIC RATING
316th/ 347
METRIC RANK
8.4%
UNEMPLOYMENT AMONG SENIORS OVER 75 YEARS
93.8/ 100
METRIC RATING
132nd/ 347
METRIC RANK
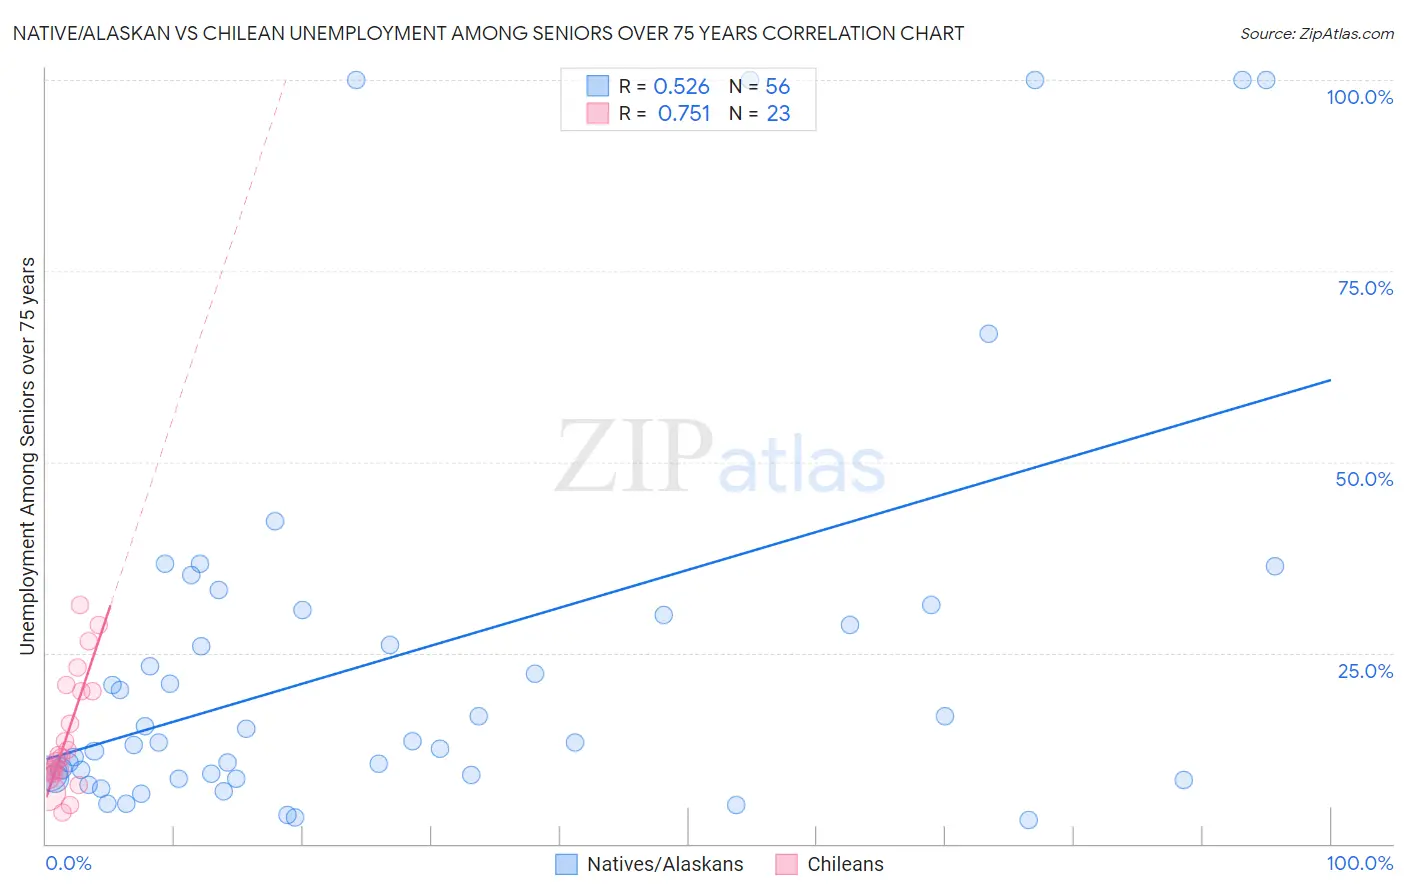
Native/Alaskan vs Chilean Unemployment Among Seniors over 75 years Correlation Chart
The statistical analysis conducted on geographies consisting of 226,317,213 people shows a substantial positive correlation between the proportion of Natives/Alaskans and unemployment rate among seniors over the age of 75 in the United States with a correlation coefficient (R) of 0.526 and weighted average of 10.2%. Similarly, the statistical analysis conducted on geographies consisting of 155,927,496 people shows a strong positive correlation between the proportion of Chileans and unemployment rate among seniors over the age of 75 in the United States with a correlation coefficient (R) of 0.751 and weighted average of 8.4%, a difference of 21.0%.
Unemployment Among Seniors over 75 years Correlation Summary
| Measurement | Native/Alaskan | Chilean |
| Minimum | 3.1% | 4.1% |
| Maximum | 100.0% | 31.3% |
| Range | 96.9% | 27.2% |
| Mean | 24.8% | 14.2% |
| Median | 13.4% | 11.2% |
| Interquartile 25% (IQ1) | 8.8% | 9.1% |
| Interquartile 75% (IQ3) | 30.3% | 20.0% |
| Interquartile Range (IQR) | 21.5% | 10.9% |
| Standard Deviation (Sample) | 26.7% | 7.7% |
| Standard Deviation (Population) | 26.4% | 7.5% |
Similar Demographics by Unemployment Among Seniors over 75 years
Demographics Similar to Natives/Alaskans by Unemployment Among Seniors over 75 years
In terms of unemployment among seniors over 75 years, the demographic groups most similar to Natives/Alaskans are Pennsylvania German (10.2%, a difference of 0.24%), Dutch West Indian (10.2%, a difference of 0.36%), Irish (10.2%, a difference of 0.37%), Liberian (10.2%, a difference of 0.49%), and German (10.3%, a difference of 0.56%).
| Demographics | Rating | Rank | Unemployment Among Seniors over 75 years |
| English | 0.0 /100 | #309 | Tragic 10.1% |
| Hungarians | 0.0 /100 | #310 | Tragic 10.1% |
| Scottish | 0.0 /100 | #311 | Tragic 10.1% |
| Chippewa | 0.0 /100 | #312 | Tragic 10.1% |
| Nepalese | 0.0 /100 | #313 | Tragic 10.1% |
| Dutch West Indians | 0.0 /100 | #314 | Tragic 10.2% |
| Pennsylvania Germans | 0.0 /100 | #315 | Tragic 10.2% |
| Natives/Alaskans | 0.0 /100 | #316 | Tragic 10.2% |
| Irish | 0.0 /100 | #317 | Tragic 10.2% |
| Liberians | 0.0 /100 | #318 | Tragic 10.2% |
| Germans | 0.0 /100 | #319 | Tragic 10.3% |
| French | 0.0 /100 | #320 | Tragic 10.3% |
| Aleuts | 0.0 /100 | #321 | Tragic 10.3% |
| Poles | 0.0 /100 | #322 | Tragic 10.3% |
| Tongans | 0.0 /100 | #323 | Tragic 10.4% |
Demographics Similar to Chileans by Unemployment Among Seniors over 75 years
In terms of unemployment among seniors over 75 years, the demographic groups most similar to Chileans are Serbian (8.4%, a difference of 0.030%), Immigrants from Czechoslovakia (8.4%, a difference of 0.11%), German Russian (8.4%, a difference of 0.28%), Apache (8.4%, a difference of 0.37%), and Haitian (8.5%, a difference of 0.50%).
| Demographics | Rating | Rank | Unemployment Among Seniors over 75 years |
| Immigrants | Moldova | 96.7 /100 | #125 | Exceptional 8.3% |
| Belizeans | 96.3 /100 | #126 | Exceptional 8.4% |
| Hondurans | 96.2 /100 | #127 | Exceptional 8.4% |
| Native Hawaiians | 96.1 /100 | #128 | Exceptional 8.4% |
| Ghanaians | 96.0 /100 | #129 | Exceptional 8.4% |
| Apache | 95.2 /100 | #130 | Exceptional 8.4% |
| German Russians | 94.9 /100 | #131 | Exceptional 8.4% |
| Chileans | 93.8 /100 | #132 | Exceptional 8.4% |
| Serbians | 93.7 /100 | #133 | Exceptional 8.4% |
| Immigrants | Czechoslovakia | 93.4 /100 | #134 | Exceptional 8.4% |
| Haitians | 91.4 /100 | #135 | Exceptional 8.5% |
| Immigrants | Trinidad and Tobago | 90.8 /100 | #136 | Exceptional 8.5% |
| Immigrants | Kuwait | 90.5 /100 | #137 | Exceptional 8.5% |
| Immigrants | Bulgaria | 89.6 /100 | #138 | Excellent 8.5% |
| Barbadians | 88.6 /100 | #139 | Excellent 8.5% |