Native/Alaskan vs Assyrian/Chaldean/Syriac Unemployment Among Seniors over 75 years
COMPARE
Native/Alaskan
Assyrian/Chaldean/Syriac
Unemployment Among Seniors over 75 years
Unemployment Among Seniors over 75 years Comparison
Natives/Alaskans
Assyrians/Chaldeans/Syriacs
10.2%
UNEMPLOYMENT AMONG SENIORS OVER 75 YEARS
0.0/ 100
METRIC RATING
316th/ 347
METRIC RANK
11.1%
UNEMPLOYMENT AMONG SENIORS OVER 75 YEARS
0.0/ 100
METRIC RATING
334th/ 347
METRIC RANK
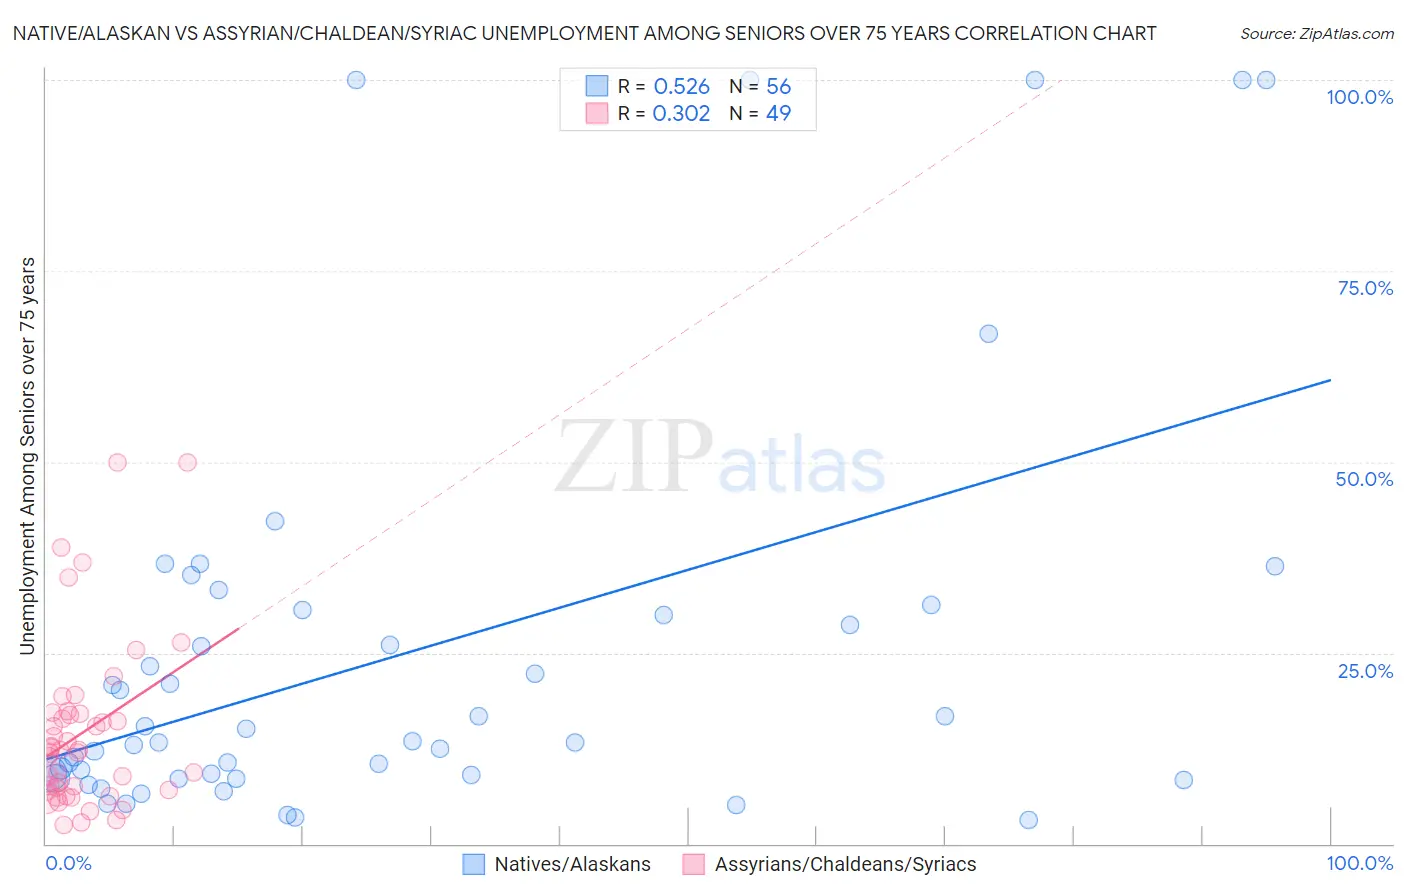
Native/Alaskan vs Assyrian/Chaldean/Syriac Unemployment Among Seniors over 75 years Correlation Chart
The statistical analysis conducted on geographies consisting of 226,317,213 people shows a substantial positive correlation between the proportion of Natives/Alaskans and unemployment rate among seniors over the age of 75 in the United States with a correlation coefficient (R) of 0.526 and weighted average of 10.2%. Similarly, the statistical analysis conducted on geographies consisting of 82,071,113 people shows a mild positive correlation between the proportion of Assyrians/Chaldeans/Syriacs and unemployment rate among seniors over the age of 75 in the United States with a correlation coefficient (R) of 0.302 and weighted average of 11.1%, a difference of 8.4%.
Unemployment Among Seniors over 75 years Correlation Summary
| Measurement | Native/Alaskan | Assyrian/Chaldean/Syriac |
| Minimum | 3.1% | 2.4% |
| Maximum | 100.0% | 50.0% |
| Range | 96.9% | 47.6% |
| Mean | 24.8% | 14.6% |
| Median | 13.4% | 12.2% |
| Interquartile 25% (IQ1) | 8.8% | 7.0% |
| Interquartile 75% (IQ3) | 30.3% | 17.2% |
| Interquartile Range (IQR) | 21.5% | 10.2% |
| Standard Deviation (Sample) | 26.7% | 11.1% |
| Standard Deviation (Population) | 26.4% | 11.0% |
Demographics Similar to Natives/Alaskans and Assyrians/Chaldeans/Syriacs by Unemployment Among Seniors over 75 years
In terms of unemployment among seniors over 75 years, the demographic groups most similar to Natives/Alaskans are Pennsylvania German (10.2%, a difference of 0.24%), Irish (10.2%, a difference of 0.37%), Liberian (10.2%, a difference of 0.49%), German (10.3%, a difference of 0.56%), and French (10.3%, a difference of 0.79%). Similarly, the demographic groups most similar to Assyrians/Chaldeans/Syriacs are Alaskan Athabascan (11.0%, a difference of 0.35%), French Canadian (11.2%, a difference of 1.1%), Immigrants from Liberia (10.9%, a difference of 1.5%), Tohono O'odham (10.8%, a difference of 2.2%), and Immigrants from the Azores (10.7%, a difference of 3.3%).
| Demographics | Rating | Rank | Unemployment Among Seniors over 75 years |
| Pennsylvania Germans | 0.0 /100 | #315 | Tragic 10.2% |
| Natives/Alaskans | 0.0 /100 | #316 | Tragic 10.2% |
| Irish | 0.0 /100 | #317 | Tragic 10.2% |
| Liberians | 0.0 /100 | #318 | Tragic 10.2% |
| Germans | 0.0 /100 | #319 | Tragic 10.3% |
| French | 0.0 /100 | #320 | Tragic 10.3% |
| Aleuts | 0.0 /100 | #321 | Tragic 10.3% |
| Poles | 0.0 /100 | #322 | Tragic 10.3% |
| Tongans | 0.0 /100 | #323 | Tragic 10.4% |
| Americans | 0.0 /100 | #324 | Tragic 10.4% |
| Portuguese | 0.0 /100 | #325 | Tragic 10.4% |
| Slovaks | 0.0 /100 | #326 | Tragic 10.4% |
| Dutch | 0.0 /100 | #327 | Tragic 10.4% |
| Immigrants | Portugal | 0.0 /100 | #328 | Tragic 10.5% |
| Tsimshian | 0.0 /100 | #329 | Tragic 10.5% |
| Immigrants | Azores | 0.0 /100 | #330 | Tragic 10.7% |
| Tohono O'odham | 0.0 /100 | #331 | Tragic 10.8% |
| Immigrants | Liberia | 0.0 /100 | #332 | Tragic 10.9% |
| Alaskan Athabascans | 0.0 /100 | #333 | Tragic 11.0% |
| Assyrians/Chaldeans/Syriacs | 0.0 /100 | #334 | Tragic 11.1% |
| French Canadians | 0.0 /100 | #335 | Tragic 11.2% |