Native/Alaskan vs Vietnamese Unemployment Among Seniors over 75 years
COMPARE
Native/Alaskan
Vietnamese
Unemployment Among Seniors over 75 years
Unemployment Among Seniors over 75 years Comparison
Natives/Alaskans
Vietnamese
10.2%
UNEMPLOYMENT AMONG SENIORS OVER 75 YEARS
0.0/ 100
METRIC RATING
316th/ 347
METRIC RANK
9.1%
UNEMPLOYMENT AMONG SENIORS OVER 75 YEARS
4.6/ 100
METRIC RATING
234th/ 347
METRIC RANK
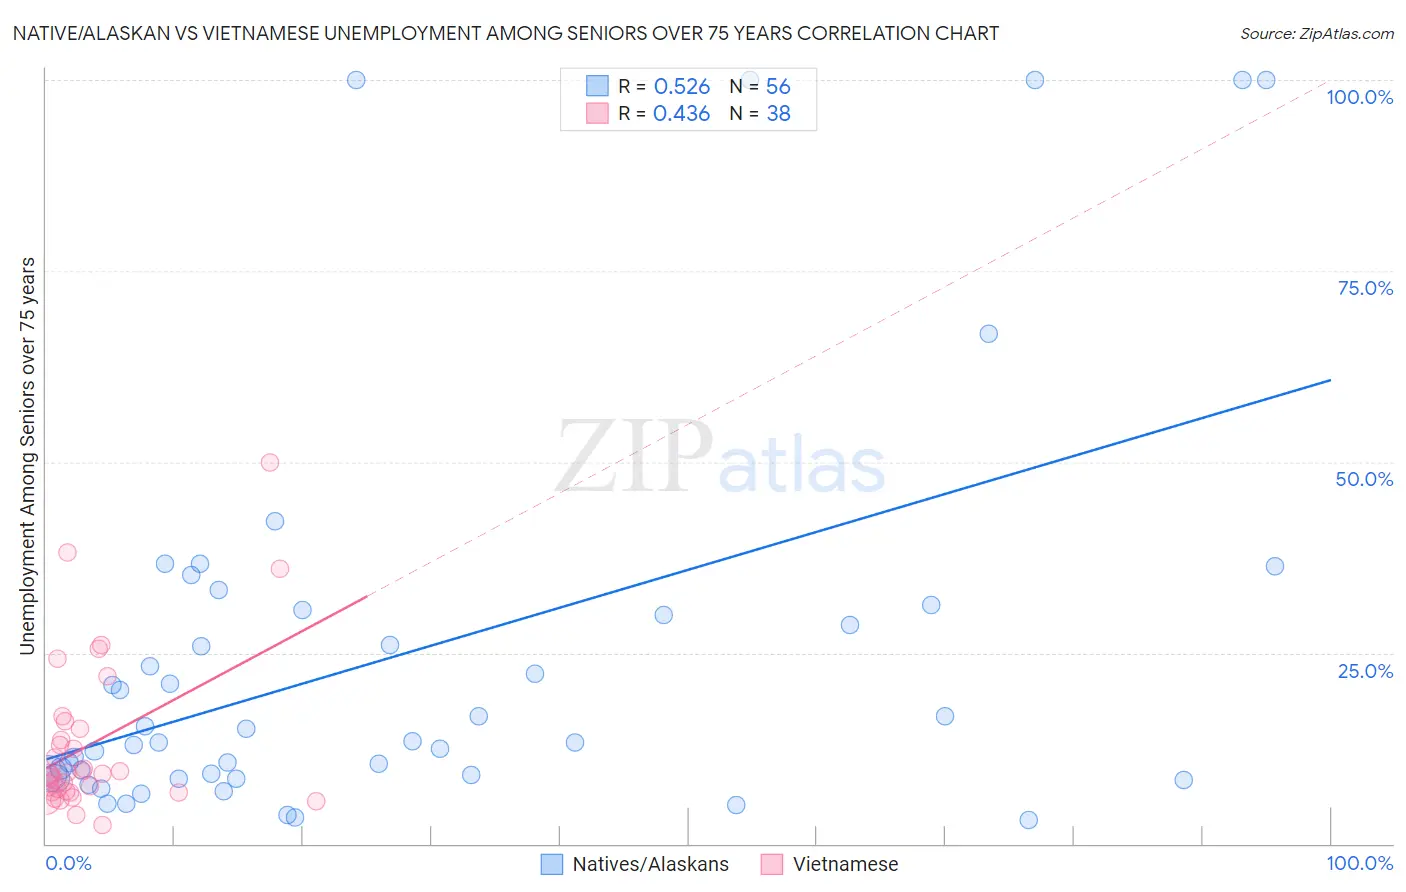
Native/Alaskan vs Vietnamese Unemployment Among Seniors over 75 years Correlation Chart
The statistical analysis conducted on geographies consisting of 226,317,213 people shows a substantial positive correlation between the proportion of Natives/Alaskans and unemployment rate among seniors over the age of 75 in the United States with a correlation coefficient (R) of 0.526 and weighted average of 10.2%. Similarly, the statistical analysis conducted on geographies consisting of 116,269,326 people shows a moderate positive correlation between the proportion of Vietnamese and unemployment rate among seniors over the age of 75 in the United States with a correlation coefficient (R) of 0.436 and weighted average of 9.1%, a difference of 12.0%.
Unemployment Among Seniors over 75 years Correlation Summary
| Measurement | Native/Alaskan | Vietnamese |
| Minimum | 3.1% | 2.4% |
| Maximum | 100.0% | 50.0% |
| Range | 96.9% | 47.6% |
| Mean | 24.8% | 13.0% |
| Median | 13.4% | 9.2% |
| Interquartile 25% (IQ1) | 8.8% | 6.7% |
| Interquartile 75% (IQ3) | 30.3% | 15.0% |
| Interquartile Range (IQR) | 21.5% | 8.3% |
| Standard Deviation (Sample) | 26.7% | 10.3% |
| Standard Deviation (Population) | 26.4% | 10.2% |
Similar Demographics by Unemployment Among Seniors over 75 years
Demographics Similar to Natives/Alaskans by Unemployment Among Seniors over 75 years
In terms of unemployment among seniors over 75 years, the demographic groups most similar to Natives/Alaskans are Pennsylvania German (10.2%, a difference of 0.24%), Dutch West Indian (10.2%, a difference of 0.36%), Irish (10.2%, a difference of 0.37%), Liberian (10.2%, a difference of 0.49%), and German (10.3%, a difference of 0.56%).
| Demographics | Rating | Rank | Unemployment Among Seniors over 75 years |
| English | 0.0 /100 | #309 | Tragic 10.1% |
| Hungarians | 0.0 /100 | #310 | Tragic 10.1% |
| Scottish | 0.0 /100 | #311 | Tragic 10.1% |
| Chippewa | 0.0 /100 | #312 | Tragic 10.1% |
| Nepalese | 0.0 /100 | #313 | Tragic 10.1% |
| Dutch West Indians | 0.0 /100 | #314 | Tragic 10.2% |
| Pennsylvania Germans | 0.0 /100 | #315 | Tragic 10.2% |
| Natives/Alaskans | 0.0 /100 | #316 | Tragic 10.2% |
| Irish | 0.0 /100 | #317 | Tragic 10.2% |
| Liberians | 0.0 /100 | #318 | Tragic 10.2% |
| Germans | 0.0 /100 | #319 | Tragic 10.3% |
| French | 0.0 /100 | #320 | Tragic 10.3% |
| Aleuts | 0.0 /100 | #321 | Tragic 10.3% |
| Poles | 0.0 /100 | #322 | Tragic 10.3% |
| Tongans | 0.0 /100 | #323 | Tragic 10.4% |
Demographics Similar to Vietnamese by Unemployment Among Seniors over 75 years
In terms of unemployment among seniors over 75 years, the demographic groups most similar to Vietnamese are Yugoslavian (9.1%, a difference of 0.050%), African (9.1%, a difference of 0.070%), Northern European (9.1%, a difference of 0.090%), Immigrants from Central America (9.1%, a difference of 0.090%), and Hispanic or Latino (9.1%, a difference of 0.10%).
| Demographics | Rating | Rank | Unemployment Among Seniors over 75 years |
| Samoans | 5.7 /100 | #227 | Tragic 9.1% |
| Kenyans | 5.4 /100 | #228 | Tragic 9.1% |
| Hispanics or Latinos | 5.0 /100 | #229 | Tragic 9.1% |
| Northern Europeans | 4.9 /100 | #230 | Tragic 9.1% |
| Immigrants | Central America | 4.9 /100 | #231 | Tragic 9.1% |
| Africans | 4.9 /100 | #232 | Tragic 9.1% |
| Yugoslavians | 4.8 /100 | #233 | Tragic 9.1% |
| Vietnamese | 4.6 /100 | #234 | Tragic 9.1% |
| Panamanians | 4.0 /100 | #235 | Tragic 9.1% |
| Jordanians | 4.0 /100 | #236 | Tragic 9.1% |
| Houma | 3.9 /100 | #237 | Tragic 9.1% |
| Inupiat | 3.6 /100 | #238 | Tragic 9.1% |
| Mexicans | 3.5 /100 | #239 | Tragic 9.1% |
| Spanish | 3.3 /100 | #240 | Tragic 9.1% |
| Immigrants | Southern Europe | 2.8 /100 | #241 | Tragic 9.2% |