Immigrants from Bosnia and Herzegovina vs Chilean Unemployment Among Seniors over 75 years
COMPARE
Immigrants from Bosnia and Herzegovina
Chilean
Unemployment Among Seniors over 75 years
Unemployment Among Seniors over 75 years Comparison
Immigrants from Bosnia and Herzegovina
Chileans
8.6%
UNEMPLOYMENT AMONG SENIORS OVER 75 YEARS
80.6/ 100
METRIC RATING
151st/ 347
METRIC RANK
8.4%
UNEMPLOYMENT AMONG SENIORS OVER 75 YEARS
93.8/ 100
METRIC RATING
132nd/ 347
METRIC RANK
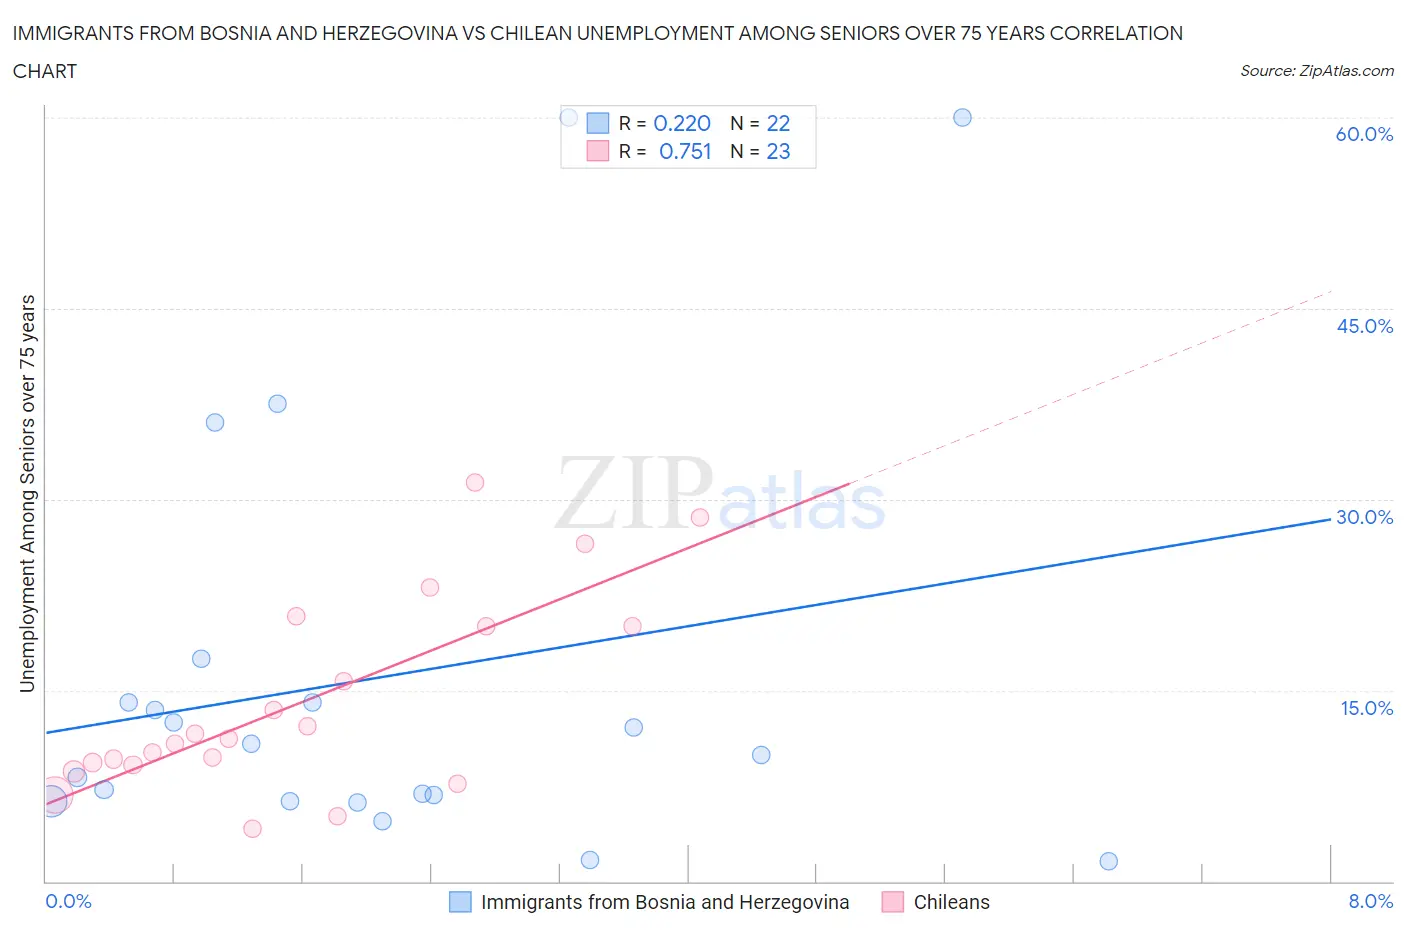
Immigrants from Bosnia and Herzegovina vs Chilean Unemployment Among Seniors over 75 years Correlation Chart
The statistical analysis conducted on geographies consisting of 104,460,173 people shows a weak positive correlation between the proportion of Immigrants from Bosnia and Herzegovina and unemployment rate among seniors over the age of 75 in the United States with a correlation coefficient (R) of 0.220 and weighted average of 8.6%. Similarly, the statistical analysis conducted on geographies consisting of 155,927,496 people shows a strong positive correlation between the proportion of Chileans and unemployment rate among seniors over the age of 75 in the United States with a correlation coefficient (R) of 0.751 and weighted average of 8.4%, a difference of 1.8%.
Unemployment Among Seniors over 75 years Correlation Summary
| Measurement | Immigrants from Bosnia and Herzegovina | Chilean |
| Minimum | 1.6% | 4.1% |
| Maximum | 60.0% | 31.3% |
| Range | 58.4% | 27.2% |
| Mean | 16.1% | 14.2% |
| Median | 10.3% | 11.2% |
| Interquartile 25% (IQ1) | 6.2% | 9.1% |
| Interquartile 75% (IQ3) | 14.1% | 20.0% |
| Interquartile Range (IQR) | 7.8% | 10.9% |
| Standard Deviation (Sample) | 16.9% | 7.7% |
| Standard Deviation (Population) | 16.5% | 7.5% |
Demographics Similar to Immigrants from Bosnia and Herzegovina and Chileans by Unemployment Among Seniors over 75 years
In terms of unemployment among seniors over 75 years, the demographic groups most similar to Immigrants from Bosnia and Herzegovina are Paiute (8.6%, a difference of 0.17%), Immigrants from Ecuador (8.5%, a difference of 0.38%), Immigrants from Sierra Leone (8.5%, a difference of 0.49%), Immigrants from Colombia (8.5%, a difference of 0.49%), and Immigrants from South Eastern Asia (8.5%, a difference of 0.51%). Similarly, the demographic groups most similar to Chileans are Serbian (8.4%, a difference of 0.030%), Immigrants from Czechoslovakia (8.4%, a difference of 0.11%), German Russian (8.4%, a difference of 0.28%), Haitian (8.5%, a difference of 0.50%), and Immigrants from Trinidad and Tobago (8.5%, a difference of 0.61%).
| Demographics | Rating | Rank | Unemployment Among Seniors over 75 years |
| German Russians | 94.9 /100 | #131 | Exceptional 8.4% |
| Chileans | 93.8 /100 | #132 | Exceptional 8.4% |
| Serbians | 93.7 /100 | #133 | Exceptional 8.4% |
| Immigrants | Czechoslovakia | 93.4 /100 | #134 | Exceptional 8.4% |
| Haitians | 91.4 /100 | #135 | Exceptional 8.5% |
| Immigrants | Trinidad and Tobago | 90.8 /100 | #136 | Exceptional 8.5% |
| Immigrants | Kuwait | 90.5 /100 | #137 | Exceptional 8.5% |
| Immigrants | Bulgaria | 89.6 /100 | #138 | Excellent 8.5% |
| Barbadians | 88.6 /100 | #139 | Excellent 8.5% |
| South Americans | 87.9 /100 | #140 | Excellent 8.5% |
| Immigrants | Bolivia | 87.9 /100 | #141 | Excellent 8.5% |
| Immigrants | Ukraine | 87.0 /100 | #142 | Excellent 8.5% |
| Immigrants | Costa Rica | 86.8 /100 | #143 | Excellent 8.5% |
| Colombians | 86.7 /100 | #144 | Excellent 8.5% |
| Immigrants | Romania | 86.2 /100 | #145 | Excellent 8.5% |
| Immigrants | South Eastern Asia | 85.8 /100 | #146 | Excellent 8.5% |
| Immigrants | Sierra Leone | 85.6 /100 | #147 | Excellent 8.5% |
| Immigrants | Colombia | 85.6 /100 | #148 | Excellent 8.5% |
| Immigrants | Ecuador | 84.6 /100 | #149 | Excellent 8.5% |
| Paiute | 82.5 /100 | #150 | Excellent 8.6% |
| Immigrants | Bosnia and Herzegovina | 80.6 /100 | #151 | Excellent 8.6% |