Native/Alaskan vs Assyrian/Chaldean/Syriac Unemployment Among Ages 25 to 29 years
COMPARE
Native/Alaskan
Assyrian/Chaldean/Syriac
Unemployment Among Ages 25 to 29 years
Unemployment Among Ages 25 to 29 years Comparison
Natives/Alaskans
Assyrians/Chaldeans/Syriacs
9.8%
UNEMPLOYMENT AMONG AGES 25 TO 29 YEARS
0.0/ 100
METRIC RATING
330th/ 347
METRIC RANK
7.3%
UNEMPLOYMENT AMONG AGES 25 TO 29 YEARS
0.2/ 100
METRIC RATING
257th/ 347
METRIC RANK
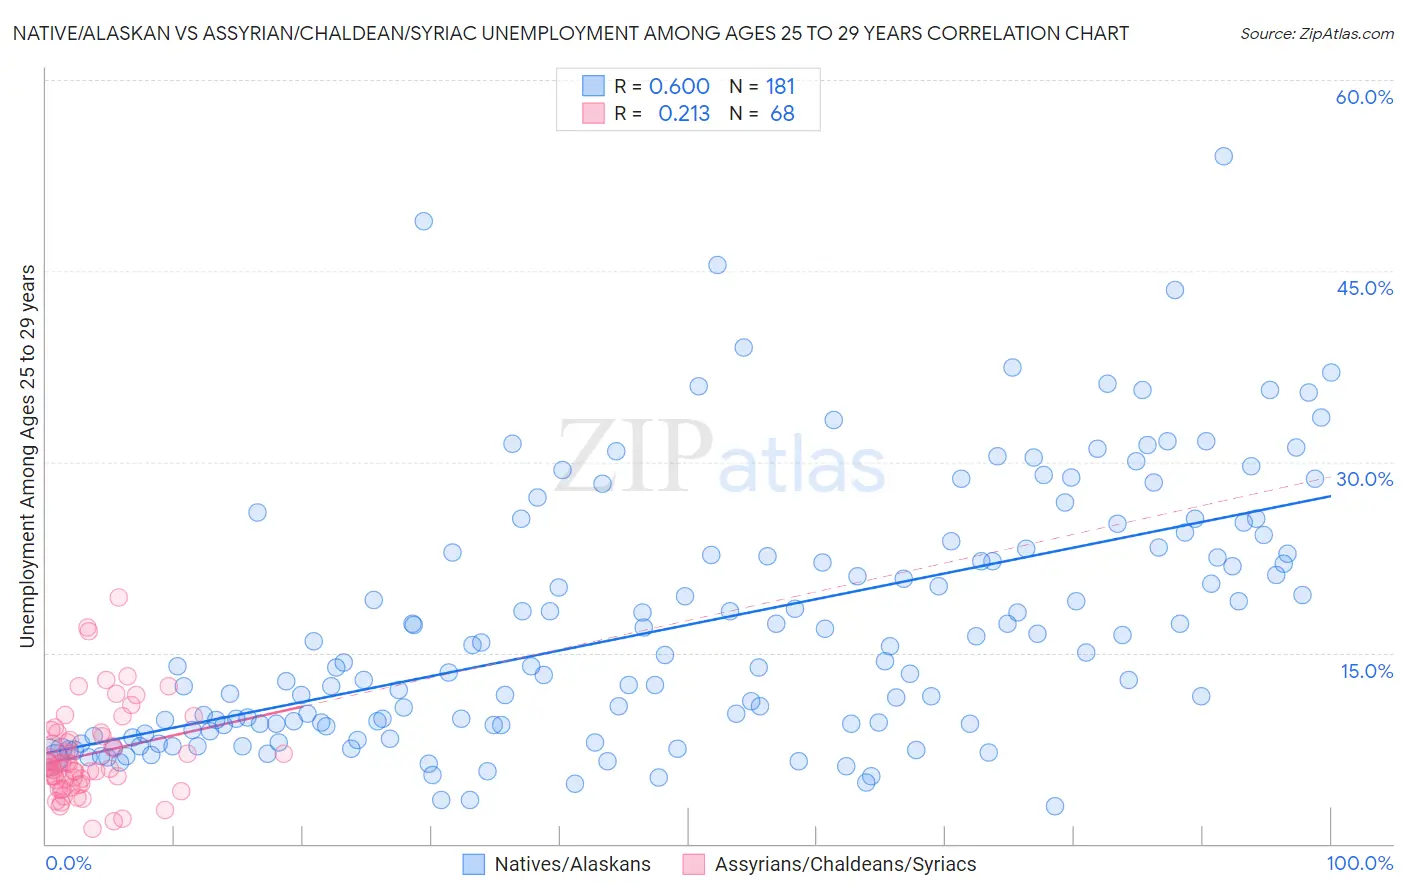
Native/Alaskan vs Assyrian/Chaldean/Syriac Unemployment Among Ages 25 to 29 years Correlation Chart
The statistical analysis conducted on geographies consisting of 472,592,888 people shows a significant positive correlation between the proportion of Natives/Alaskans and unemployment rate among population between the ages 25 and 29 in the United States with a correlation coefficient (R) of 0.600 and weighted average of 9.8%. Similarly, the statistical analysis conducted on geographies consisting of 108,796,100 people shows a weak positive correlation between the proportion of Assyrians/Chaldeans/Syriacs and unemployment rate among population between the ages 25 and 29 in the United States with a correlation coefficient (R) of 0.213 and weighted average of 7.3%, a difference of 34.9%.
Unemployment Among Ages 25 to 29 years Correlation Summary
| Measurement | Native/Alaskan | Assyrian/Chaldean/Syriac |
| Minimum | 2.9% | 1.2% |
| Maximum | 54.0% | 19.3% |
| Range | 51.1% | 18.1% |
| Mean | 17.0% | 7.0% |
| Median | 14.0% | 6.3% |
| Interquartile 25% (IQ1) | 9.1% | 4.8% |
| Interquartile 75% (IQ3) | 23.0% | 8.6% |
| Interquartile Range (IQR) | 13.9% | 3.7% |
| Standard Deviation (Sample) | 10.1% | 3.6% |
| Standard Deviation (Population) | 10.1% | 3.6% |
Similar Demographics by Unemployment Among Ages 25 to 29 years
Demographics Similar to Natives/Alaskans by Unemployment Among Ages 25 to 29 years
In terms of unemployment among ages 25 to 29 years, the demographic groups most similar to Natives/Alaskans are Aleut (9.7%, a difference of 1.4%), Apache (9.5%, a difference of 3.6%), Alaska Native (10.2%, a difference of 3.7%), Pueblo (10.4%, a difference of 6.1%), and Colville (9.2%, a difference of 6.3%).
| Demographics | Rating | Rank | Unemployment Among Ages 25 to 29 years |
| Dominicans | 0.0 /100 | #323 | Tragic 8.7% |
| Houma | 0.0 /100 | #324 | Tragic 8.7% |
| Yakama | 0.0 /100 | #325 | Tragic 8.8% |
| Shoshone | 0.0 /100 | #326 | Tragic 9.2% |
| Colville | 0.0 /100 | #327 | Tragic 9.2% |
| Apache | 0.0 /100 | #328 | Tragic 9.5% |
| Aleuts | 0.0 /100 | #329 | Tragic 9.7% |
| Natives/Alaskans | 0.0 /100 | #330 | Tragic 9.8% |
| Alaska Natives | 0.0 /100 | #331 | Tragic 10.2% |
| Pueblo | 0.0 /100 | #332 | Tragic 10.4% |
| Alaskan Athabascans | 0.0 /100 | #333 | Tragic 10.8% |
| Yuman | 0.0 /100 | #334 | Tragic 11.0% |
| Puerto Ricans | 0.0 /100 | #335 | Tragic 11.1% |
| Lumbee | 0.0 /100 | #336 | Tragic 11.2% |
| Menominee | 0.0 /100 | #337 | Tragic 11.3% |
Demographics Similar to Assyrians/Chaldeans/Syriacs by Unemployment Among Ages 25 to 29 years
In terms of unemployment among ages 25 to 29 years, the demographic groups most similar to Assyrians/Chaldeans/Syriacs are Mexican American Indian (7.3%, a difference of 0.37%), Ottawa (7.3%, a difference of 0.40%), Immigrants from Cameroon (7.2%, a difference of 0.57%), Cree (7.3%, a difference of 0.61%), and Ghanaian (7.2%, a difference of 0.63%).
| Demographics | Rating | Rank | Unemployment Among Ages 25 to 29 years |
| Delaware | 0.5 /100 | #250 | Tragic 7.2% |
| Portuguese | 0.5 /100 | #251 | Tragic 7.2% |
| Sierra Leoneans | 0.4 /100 | #252 | Tragic 7.2% |
| Immigrants | Portugal | 0.3 /100 | #253 | Tragic 7.2% |
| Ghanaians | 0.3 /100 | #254 | Tragic 7.2% |
| Immigrants | Cameroon | 0.3 /100 | #255 | Tragic 7.2% |
| Mexican American Indians | 0.3 /100 | #256 | Tragic 7.3% |
| Assyrians/Chaldeans/Syriacs | 0.2 /100 | #257 | Tragic 7.3% |
| Ottawa | 0.1 /100 | #258 | Tragic 7.3% |
| Cree | 0.1 /100 | #259 | Tragic 7.3% |
| Americans | 0.1 /100 | #260 | Tragic 7.4% |
| Nigerians | 0.1 /100 | #261 | Tragic 7.4% |
| Ecuadorians | 0.1 /100 | #262 | Tragic 7.4% |
| Kiowa | 0.1 /100 | #263 | Tragic 7.4% |
| Immigrants | Western Africa | 0.1 /100 | #264 | Tragic 7.4% |