Laotian vs Latvian Male Unemployment
COMPARE
Laotian
Latvian
Male Unemployment
Male Unemployment Comparison
Laotians
Latvians
5.2%
MALE UNEMPLOYMENT
73.8/ 100
METRIC RATING
154th/ 347
METRIC RANK
4.8%
MALE UNEMPLOYMENT
99.7/ 100
METRIC RATING
33rd/ 347
METRIC RANK
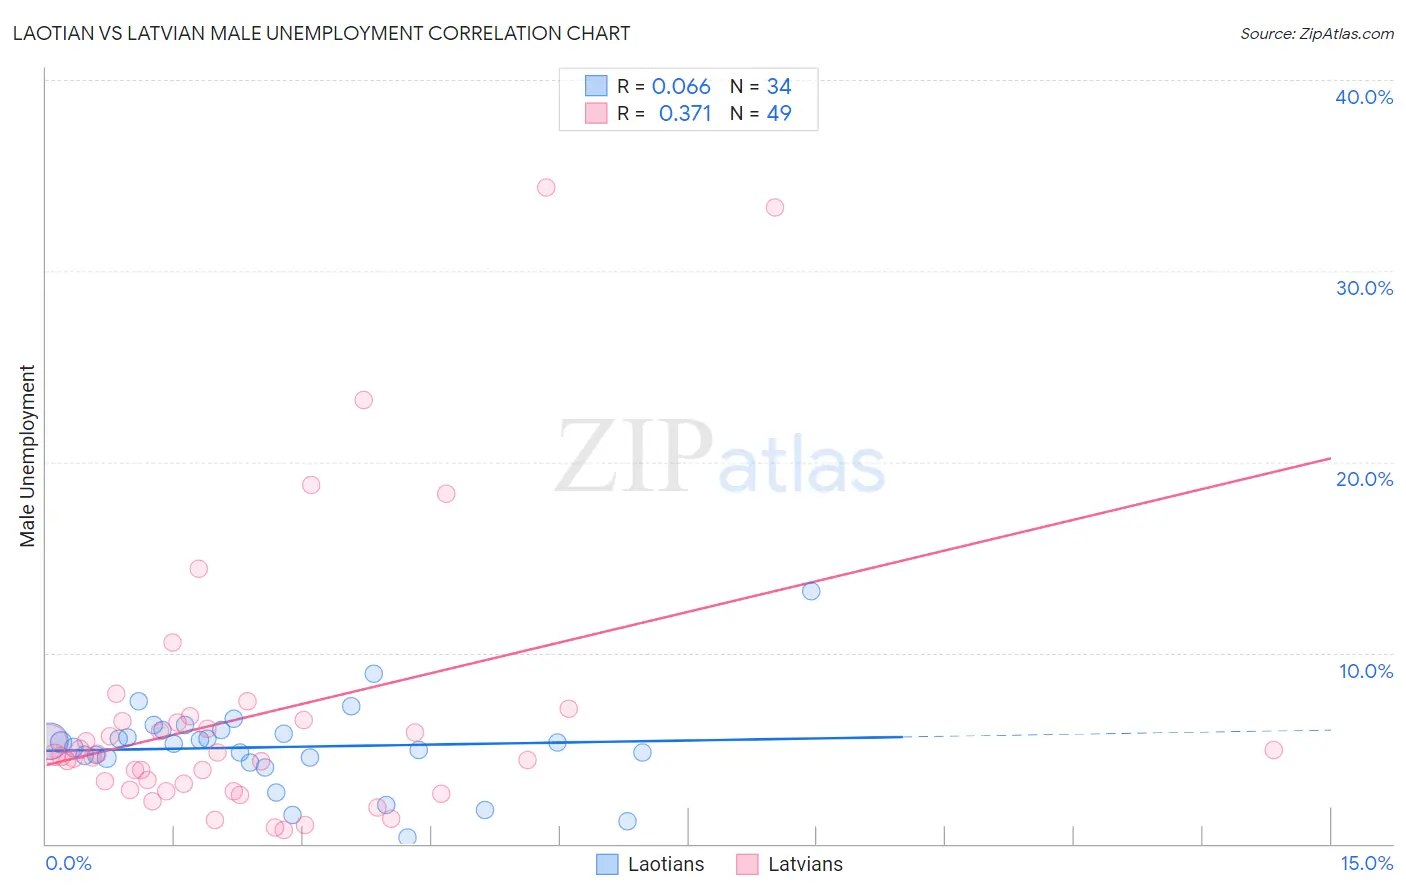
Laotian vs Latvian Male Unemployment Correlation Chart
The statistical analysis conducted on geographies consisting of 224,510,892 people shows a slight positive correlation between the proportion of Laotians and unemployment rate among males in the United States with a correlation coefficient (R) of 0.066 and weighted average of 5.2%. Similarly, the statistical analysis conducted on geographies consisting of 220,207,220 people shows a mild positive correlation between the proportion of Latvians and unemployment rate among males in the United States with a correlation coefficient (R) of 0.371 and weighted average of 4.8%, a difference of 7.6%.
Male Unemployment Correlation Summary
| Measurement | Laotian | Latvian |
| Minimum | 0.30% | 0.70% |
| Maximum | 13.2% | 34.4% |
| Range | 12.9% | 33.7% |
| Mean | 5.1% | 6.7% |
| Median | 5.3% | 4.7% |
| Interquartile 25% (IQ1) | 4.5% | 3.0% |
| Interquartile 75% (IQ3) | 5.9% | 6.5% |
| Interquartile Range (IQR) | 1.4% | 3.5% |
| Standard Deviation (Sample) | 2.3% | 7.2% |
| Standard Deviation (Population) | 2.3% | 7.2% |
Similar Demographics by Male Unemployment
Demographics Similar to Laotians by Male Unemployment
In terms of male unemployment, the demographic groups most similar to Laotians are Immigrants from Uruguay (5.2%, a difference of 0.010%), Immigrants from Hungary (5.2%, a difference of 0.030%), Egyptian (5.2%, a difference of 0.080%), American (5.2%, a difference of 0.090%), and Immigrants from Northern Africa (5.2%, a difference of 0.12%).
| Demographics | Rating | Rank | Male Unemployment |
| Immigrants | Burma/Myanmar | 77.5 /100 | #147 | Good 5.2% |
| Immigrants | Italy | 76.3 /100 | #148 | Good 5.2% |
| Immigrants | Europe | 76.2 /100 | #149 | Good 5.2% |
| Indians (Asian) | 76.0 /100 | #150 | Good 5.2% |
| Slovaks | 75.5 /100 | #151 | Good 5.2% |
| Egyptians | 74.8 /100 | #152 | Good 5.2% |
| Immigrants | Uruguay | 73.9 /100 | #153 | Good 5.2% |
| Laotians | 73.8 /100 | #154 | Good 5.2% |
| Immigrants | Hungary | 73.4 /100 | #155 | Good 5.2% |
| Americans | 72.7 /100 | #156 | Good 5.2% |
| Immigrants | Northern Africa | 72.3 /100 | #157 | Good 5.2% |
| Immigrants | Indonesia | 71.5 /100 | #158 | Good 5.2% |
| Indonesians | 71.2 /100 | #159 | Good 5.2% |
| Immigrants | Norway | 71.0 /100 | #160 | Good 5.2% |
| Immigrants | China | 70.6 /100 | #161 | Good 5.2% |
Demographics Similar to Latvians by Male Unemployment
In terms of male unemployment, the demographic groups most similar to Latvians are Welsh (4.8%, a difference of 0.080%), Immigrants from Nepal (4.8%, a difference of 0.30%), Sudanese (4.8%, a difference of 0.31%), British (4.8%, a difference of 0.56%), and Scottish (4.8%, a difference of 0.88%).
| Demographics | Rating | Rank | Male Unemployment |
| Dutch | 99.9 /100 | #26 | Exceptional 4.8% |
| Belgians | 99.9 /100 | #27 | Exceptional 4.8% |
| Bulgarians | 99.8 /100 | #28 | Exceptional 4.8% |
| Scottish | 99.8 /100 | #29 | Exceptional 4.8% |
| British | 99.8 /100 | #30 | Exceptional 4.8% |
| Sudanese | 99.8 /100 | #31 | Exceptional 4.8% |
| Immigrants | Nepal | 99.8 /100 | #32 | Exceptional 4.8% |
| Latvians | 99.7 /100 | #33 | Exceptional 4.8% |
| Welsh | 99.7 /100 | #34 | Exceptional 4.8% |
| Paraguayans | 99.5 /100 | #35 | Exceptional 4.9% |
| Immigrants | Singapore | 99.4 /100 | #36 | Exceptional 4.9% |
| Scotch-Irish | 99.4 /100 | #37 | Exceptional 4.9% |
| Immigrants | Bosnia and Herzegovina | 99.4 /100 | #38 | Exceptional 4.9% |
| Burmese | 99.3 /100 | #39 | Exceptional 4.9% |
| Northern Europeans | 99.3 /100 | #40 | Exceptional 4.9% |