Japanese vs Latvian Male Unemployment
COMPARE
Japanese
Latvian
Male Unemployment
Male Unemployment Comparison
Japanese
Latvians
5.8%
MALE UNEMPLOYMENT
0.2/ 100
METRIC RATING
254th/ 347
METRIC RANK
4.8%
MALE UNEMPLOYMENT
99.7/ 100
METRIC RATING
33rd/ 347
METRIC RANK
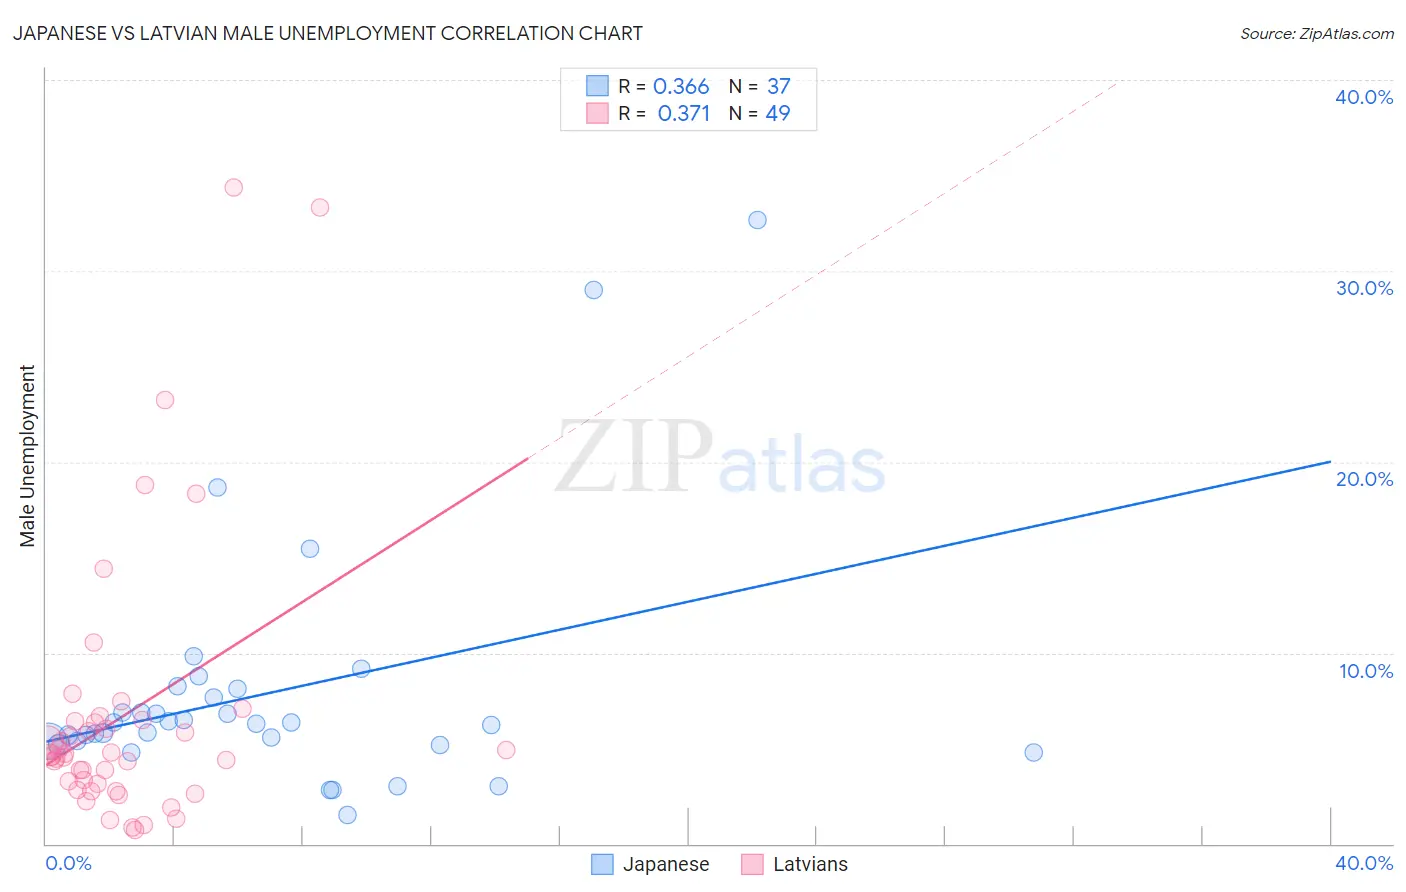
Japanese vs Latvian Male Unemployment Correlation Chart
The statistical analysis conducted on geographies consisting of 248,784,678 people shows a mild positive correlation between the proportion of Japanese and unemployment rate among males in the United States with a correlation coefficient (R) of 0.366 and weighted average of 5.8%. Similarly, the statistical analysis conducted on geographies consisting of 220,207,220 people shows a mild positive correlation between the proportion of Latvians and unemployment rate among males in the United States with a correlation coefficient (R) of 0.371 and weighted average of 4.8%, a difference of 19.3%.
Male Unemployment Correlation Summary
| Measurement | Japanese | Latvian |
| Minimum | 1.5% | 0.70% |
| Maximum | 32.7% | 34.4% |
| Range | 31.2% | 33.7% |
| Mean | 7.9% | 6.7% |
| Median | 6.3% | 4.7% |
| Interquartile 25% (IQ1) | 5.3% | 3.0% |
| Interquartile 75% (IQ3) | 7.9% | 6.5% |
| Interquartile Range (IQR) | 2.6% | 3.5% |
| Standard Deviation (Sample) | 6.4% | 7.2% |
| Standard Deviation (Population) | 6.3% | 7.2% |
Similar Demographics by Male Unemployment
Demographics Similar to Japanese by Male Unemployment
In terms of male unemployment, the demographic groups most similar to Japanese are Kiowa (5.8%, a difference of 0.10%), Mexican American Indian (5.8%, a difference of 0.17%), Comanche (5.8%, a difference of 0.18%), Mexican (5.8%, a difference of 0.30%), and Hispanic or Latino (5.8%, a difference of 0.35%).
| Demographics | Rating | Rank | Male Unemployment |
| Hawaiians | 0.6 /100 | #247 | Tragic 5.7% |
| Marshallese | 0.5 /100 | #248 | Tragic 5.7% |
| Cree | 0.4 /100 | #249 | Tragic 5.7% |
| Immigrants | Bahamas | 0.4 /100 | #250 | Tragic 5.7% |
| Spanish Americans | 0.3 /100 | #251 | Tragic 5.7% |
| Mexicans | 0.2 /100 | #252 | Tragic 5.8% |
| Mexican American Indians | 0.2 /100 | #253 | Tragic 5.8% |
| Japanese | 0.2 /100 | #254 | Tragic 5.8% |
| Kiowa | 0.2 /100 | #255 | Tragic 5.8% |
| Comanche | 0.2 /100 | #256 | Tragic 5.8% |
| Hispanics or Latinos | 0.1 /100 | #257 | Tragic 5.8% |
| Dutch West Indians | 0.1 /100 | #258 | Tragic 5.8% |
| Cajuns | 0.1 /100 | #259 | Tragic 5.8% |
| Immigrants | Central America | 0.1 /100 | #260 | Tragic 5.8% |
| Liberians | 0.1 /100 | #261 | Tragic 5.8% |
Demographics Similar to Latvians by Male Unemployment
In terms of male unemployment, the demographic groups most similar to Latvians are Welsh (4.8%, a difference of 0.080%), Immigrants from Nepal (4.8%, a difference of 0.30%), Sudanese (4.8%, a difference of 0.31%), British (4.8%, a difference of 0.56%), and Scottish (4.8%, a difference of 0.88%).
| Demographics | Rating | Rank | Male Unemployment |
| Dutch | 99.9 /100 | #26 | Exceptional 4.8% |
| Belgians | 99.9 /100 | #27 | Exceptional 4.8% |
| Bulgarians | 99.8 /100 | #28 | Exceptional 4.8% |
| Scottish | 99.8 /100 | #29 | Exceptional 4.8% |
| British | 99.8 /100 | #30 | Exceptional 4.8% |
| Sudanese | 99.8 /100 | #31 | Exceptional 4.8% |
| Immigrants | Nepal | 99.8 /100 | #32 | Exceptional 4.8% |
| Latvians | 99.7 /100 | #33 | Exceptional 4.8% |
| Welsh | 99.7 /100 | #34 | Exceptional 4.8% |
| Paraguayans | 99.5 /100 | #35 | Exceptional 4.9% |
| Immigrants | Singapore | 99.4 /100 | #36 | Exceptional 4.9% |
| Scotch-Irish | 99.4 /100 | #37 | Exceptional 4.9% |
| Immigrants | Bosnia and Herzegovina | 99.4 /100 | #38 | Exceptional 4.9% |
| Burmese | 99.3 /100 | #39 | Exceptional 4.9% |
| Northern Europeans | 99.3 /100 | #40 | Exceptional 4.9% |