Menominee vs West Indian Male Unemployment
COMPARE
Menominee
West Indian
Male Unemployment
Male Unemployment Comparison
Menominee
West Indians
6.0%
MALE UNEMPLOYMENT
0.0/ 100
METRIC RATING
275th/ 347
METRIC RANK
6.7%
MALE UNEMPLOYMENT
0.0/ 100
METRIC RATING
304th/ 347
METRIC RANK
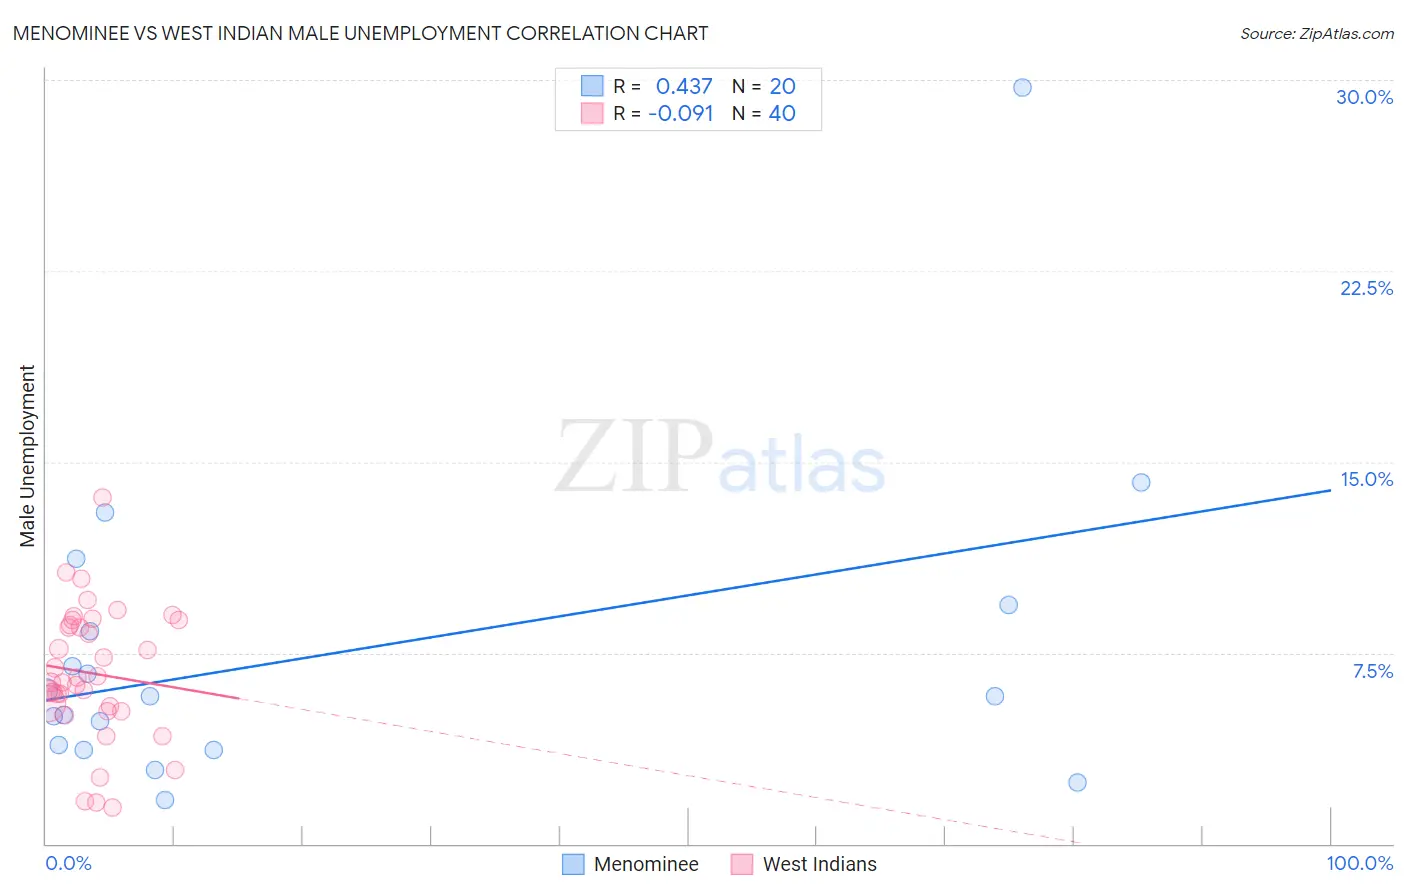
Menominee vs West Indian Male Unemployment Correlation Chart
The statistical analysis conducted on geographies consisting of 45,696,214 people shows a moderate positive correlation between the proportion of Menominee and unemployment rate among males in the United States with a correlation coefficient (R) of 0.437 and weighted average of 6.0%. Similarly, the statistical analysis conducted on geographies consisting of 253,602,585 people shows a slight negative correlation between the proportion of West Indians and unemployment rate among males in the United States with a correlation coefficient (R) of -0.091 and weighted average of 6.7%, a difference of 10.6%.
Male Unemployment Correlation Summary
| Measurement | Menominee | West Indian |
| Minimum | 1.7% | 1.4% |
| Maximum | 29.7% | 13.6% |
| Range | 28.0% | 12.2% |
| Mean | 7.5% | 6.7% |
| Median | 5.8% | 6.4% |
| Interquartile 25% (IQ1) | 3.8% | 5.3% |
| Interquartile 75% (IQ3) | 8.9% | 8.7% |
| Interquartile Range (IQR) | 5.1% | 3.4% |
| Standard Deviation (Sample) | 6.2% | 2.6% |
| Standard Deviation (Population) | 6.1% | 2.6% |
Similar Demographics by Male Unemployment
Demographics Similar to Menominee by Male Unemployment
In terms of male unemployment, the demographic groups most similar to Menominee are Tlingit-Haida (6.0%, a difference of 0.10%), Immigrants from Sierra Leone (6.0%, a difference of 0.15%), Armenian (6.0%, a difference of 0.33%), Immigrants from Uzbekistan (6.0%, a difference of 0.34%), and Immigrants from Liberia (6.1%, a difference of 0.52%).
| Demographics | Rating | Rank | Male Unemployment |
| Bermudans | 0.0 /100 | #268 | Tragic 5.9% |
| Immigrants | Nigeria | 0.0 /100 | #269 | Tragic 6.0% |
| Sub-Saharan Africans | 0.0 /100 | #270 | Tragic 6.0% |
| Blackfeet | 0.0 /100 | #271 | Tragic 6.0% |
| Immigrants | Uzbekistan | 0.0 /100 | #272 | Tragic 6.0% |
| Armenians | 0.0 /100 | #273 | Tragic 6.0% |
| Immigrants | Sierra Leone | 0.0 /100 | #274 | Tragic 6.0% |
| Menominee | 0.0 /100 | #275 | Tragic 6.0% |
| Tlingit-Haida | 0.0 /100 | #276 | Tragic 6.0% |
| Immigrants | Liberia | 0.0 /100 | #277 | Tragic 6.1% |
| Immigrants | Fiji | 0.0 /100 | #278 | Tragic 6.1% |
| Ghanaians | 0.0 /100 | #279 | Tragic 6.1% |
| Immigrants | Ghana | 0.0 /100 | #280 | Tragic 6.2% |
| Sierra Leoneans | 0.0 /100 | #281 | Tragic 6.2% |
| Ecuadorians | 0.0 /100 | #282 | Tragic 6.2% |
Demographics Similar to West Indians by Male Unemployment
In terms of male unemployment, the demographic groups most similar to West Indians are Immigrants from West Indies (6.7%, a difference of 0.0%), Trinidadian and Tobagonian (6.7%, a difference of 0.32%), Ute (6.6%, a difference of 0.37%), Immigrants from Trinidad and Tobago (6.7%, a difference of 0.52%), and Immigrants from Jamaica (6.7%, a difference of 0.60%).
| Demographics | Rating | Rank | Male Unemployment |
| Chippewa | 0.0 /100 | #297 | Tragic 6.6% |
| Jamaicans | 0.0 /100 | #298 | Tragic 6.6% |
| Immigrants | Bangladesh | 0.0 /100 | #299 | Tragic 6.6% |
| Vietnamese | 0.0 /100 | #300 | Tragic 6.6% |
| Immigrants | Belize | 0.0 /100 | #301 | Tragic 6.6% |
| Ute | 0.0 /100 | #302 | Tragic 6.6% |
| Immigrants | West Indies | 0.0 /100 | #303 | Tragic 6.7% |
| West Indians | 0.0 /100 | #304 | Tragic 6.7% |
| Trinidadians and Tobagonians | 0.0 /100 | #305 | Tragic 6.7% |
| Immigrants | Trinidad and Tobago | 0.0 /100 | #306 | Tragic 6.7% |
| Immigrants | Jamaica | 0.0 /100 | #307 | Tragic 6.7% |
| Aleuts | 0.0 /100 | #308 | Tragic 6.8% |
| Barbadians | 0.0 /100 | #309 | Tragic 6.9% |
| Blacks/African Americans | 0.0 /100 | #310 | Tragic 6.9% |
| Immigrants | Armenia | 0.0 /100 | #311 | Tragic 6.9% |