Liberian vs Immigrants from Cameroon Male Unemployment
COMPARE
Liberian
Immigrants from Cameroon
Male Unemployment
Male Unemployment Comparison
Liberians
Immigrants from Cameroon
5.8%
MALE UNEMPLOYMENT
0.1/ 100
METRIC RATING
261st/ 347
METRIC RANK
5.6%
MALE UNEMPLOYMENT
1.0/ 100
METRIC RATING
240th/ 347
METRIC RANK
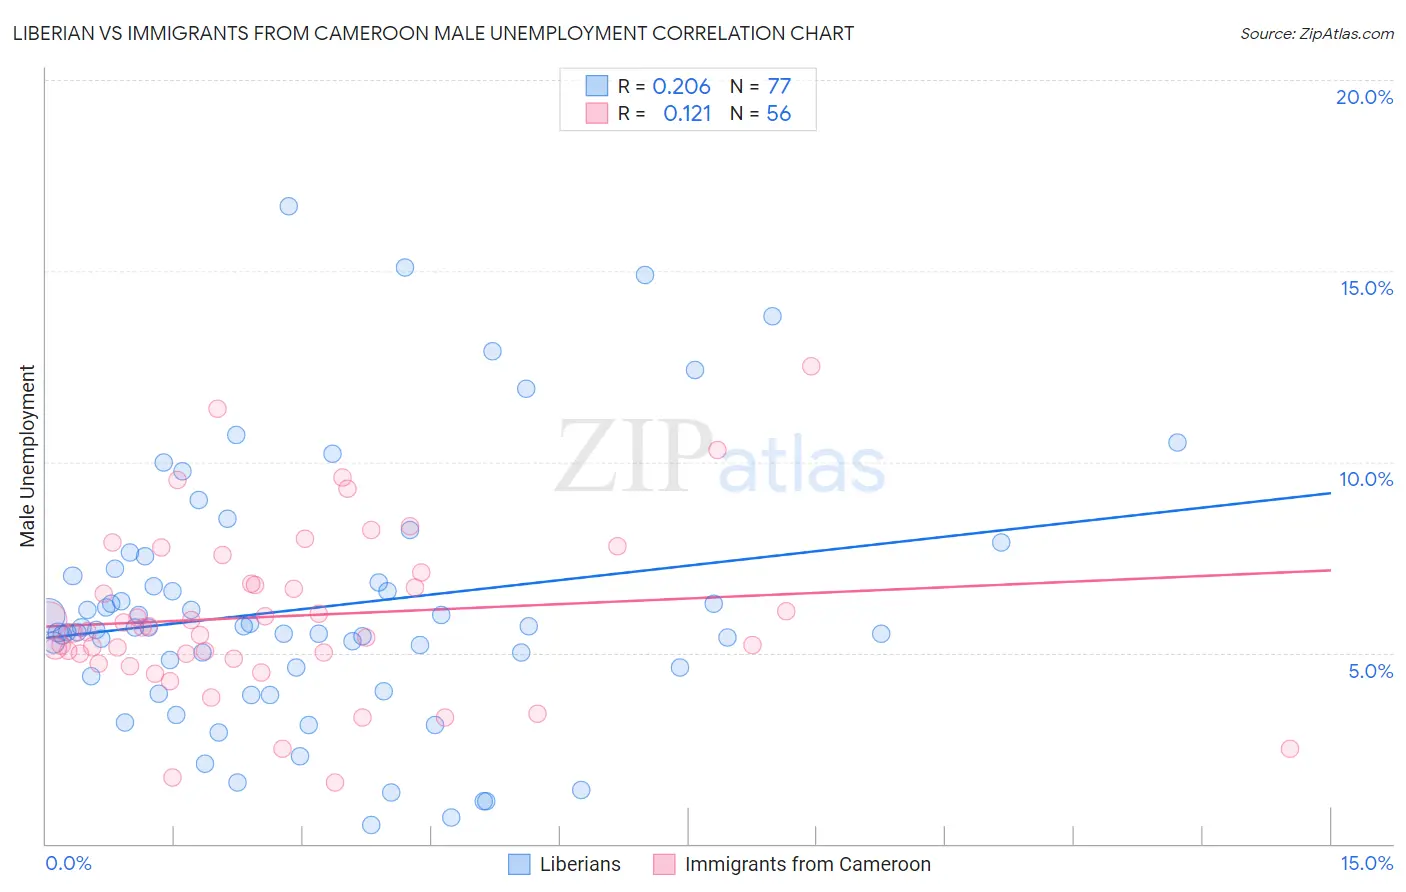
Liberian vs Immigrants from Cameroon Male Unemployment Correlation Chart
The statistical analysis conducted on geographies consisting of 117,984,986 people shows a weak positive correlation between the proportion of Liberians and unemployment rate among males in the United States with a correlation coefficient (R) of 0.206 and weighted average of 5.8%. Similarly, the statistical analysis conducted on geographies consisting of 130,586,445 people shows a poor positive correlation between the proportion of Immigrants from Cameroon and unemployment rate among males in the United States with a correlation coefficient (R) of 0.121 and weighted average of 5.6%, a difference of 3.3%.
Male Unemployment Correlation Summary
| Measurement | Liberian | Immigrants from Cameroon |
| Minimum | 0.50% | 1.6% |
| Maximum | 16.7% | 12.5% |
| Range | 16.2% | 10.9% |
| Mean | 6.2% | 6.0% |
| Median | 5.7% | 5.6% |
| Interquartile 25% (IQ1) | 4.5% | 4.9% |
| Interquartile 75% (IQ3) | 7.1% | 7.0% |
| Interquartile Range (IQR) | 2.6% | 2.0% |
| Standard Deviation (Sample) | 3.3% | 2.2% |
| Standard Deviation (Population) | 3.3% | 2.2% |
Similar Demographics by Male Unemployment
Demographics Similar to Liberians by Male Unemployment
In terms of male unemployment, the demographic groups most similar to Liberians are Immigrants from Central America (5.8%, a difference of 0.18%), Cajun (5.8%, a difference of 0.24%), Dutch West Indian (5.8%, a difference of 0.39%), Immigrants from Portugal (5.9%, a difference of 0.45%), and Hispanic or Latino (5.8%, a difference of 0.53%).
| Demographics | Rating | Rank | Male Unemployment |
| Japanese | 0.2 /100 | #254 | Tragic 5.8% |
| Kiowa | 0.2 /100 | #255 | Tragic 5.8% |
| Comanche | 0.2 /100 | #256 | Tragic 5.8% |
| Hispanics or Latinos | 0.1 /100 | #257 | Tragic 5.8% |
| Dutch West Indians | 0.1 /100 | #258 | Tragic 5.8% |
| Cajuns | 0.1 /100 | #259 | Tragic 5.8% |
| Immigrants | Central America | 0.1 /100 | #260 | Tragic 5.8% |
| Liberians | 0.1 /100 | #261 | Tragic 5.8% |
| Immigrants | Portugal | 0.1 /100 | #262 | Tragic 5.9% |
| Immigrants | Latin America | 0.1 /100 | #263 | Tragic 5.9% |
| Immigrants | Mexico | 0.0 /100 | #264 | Tragic 5.9% |
| French American Indians | 0.0 /100 | #265 | Tragic 5.9% |
| Bahamians | 0.0 /100 | #266 | Tragic 5.9% |
| Nigerians | 0.0 /100 | #267 | Tragic 5.9% |
| Bermudans | 0.0 /100 | #268 | Tragic 5.9% |
Demographics Similar to Immigrants from Cameroon by Male Unemployment
In terms of male unemployment, the demographic groups most similar to Immigrants from Cameroon are Salvadoran (5.7%, a difference of 0.040%), Native Hawaiian (5.6%, a difference of 0.070%), Immigrants from Guatemala (5.6%, a difference of 0.070%), Ottawa (5.7%, a difference of 0.11%), and Honduran (5.6%, a difference of 0.12%).
| Demographics | Rating | Rank | Male Unemployment |
| Somalis | 1.5 /100 | #233 | Tragic 5.6% |
| Immigrants | Somalia | 1.5 /100 | #234 | Tragic 5.6% |
| Immigrants | Honduras | 1.5 /100 | #235 | Tragic 5.6% |
| Guatemalans | 1.2 /100 | #236 | Tragic 5.6% |
| Hondurans | 1.1 /100 | #237 | Tragic 5.6% |
| Native Hawaiians | 1.1 /100 | #238 | Tragic 5.6% |
| Immigrants | Guatemala | 1.1 /100 | #239 | Tragic 5.6% |
| Immigrants | Cameroon | 1.0 /100 | #240 | Tragic 5.6% |
| Salvadorans | 1.0 /100 | #241 | Tragic 5.7% |
| Ottawa | 0.9 /100 | #242 | Tragic 5.7% |
| Bangladeshis | 0.8 /100 | #243 | Tragic 5.7% |
| Immigrants | El Salvador | 0.7 /100 | #244 | Tragic 5.7% |
| Yaqui | 0.7 /100 | #245 | Tragic 5.7% |
| Iroquois | 0.6 /100 | #246 | Tragic 5.7% |
| Hawaiians | 0.6 /100 | #247 | Tragic 5.7% |