Dominican vs Immigrants from Cameroon Male Unemployment
COMPARE
Dominican
Immigrants from Cameroon
Male Unemployment
Male Unemployment Comparison
Dominicans
Immigrants from Cameroon
7.6%
MALE UNEMPLOYMENT
0.0/ 100
METRIC RATING
324th/ 347
METRIC RANK
5.6%
MALE UNEMPLOYMENT
1.0/ 100
METRIC RATING
240th/ 347
METRIC RANK
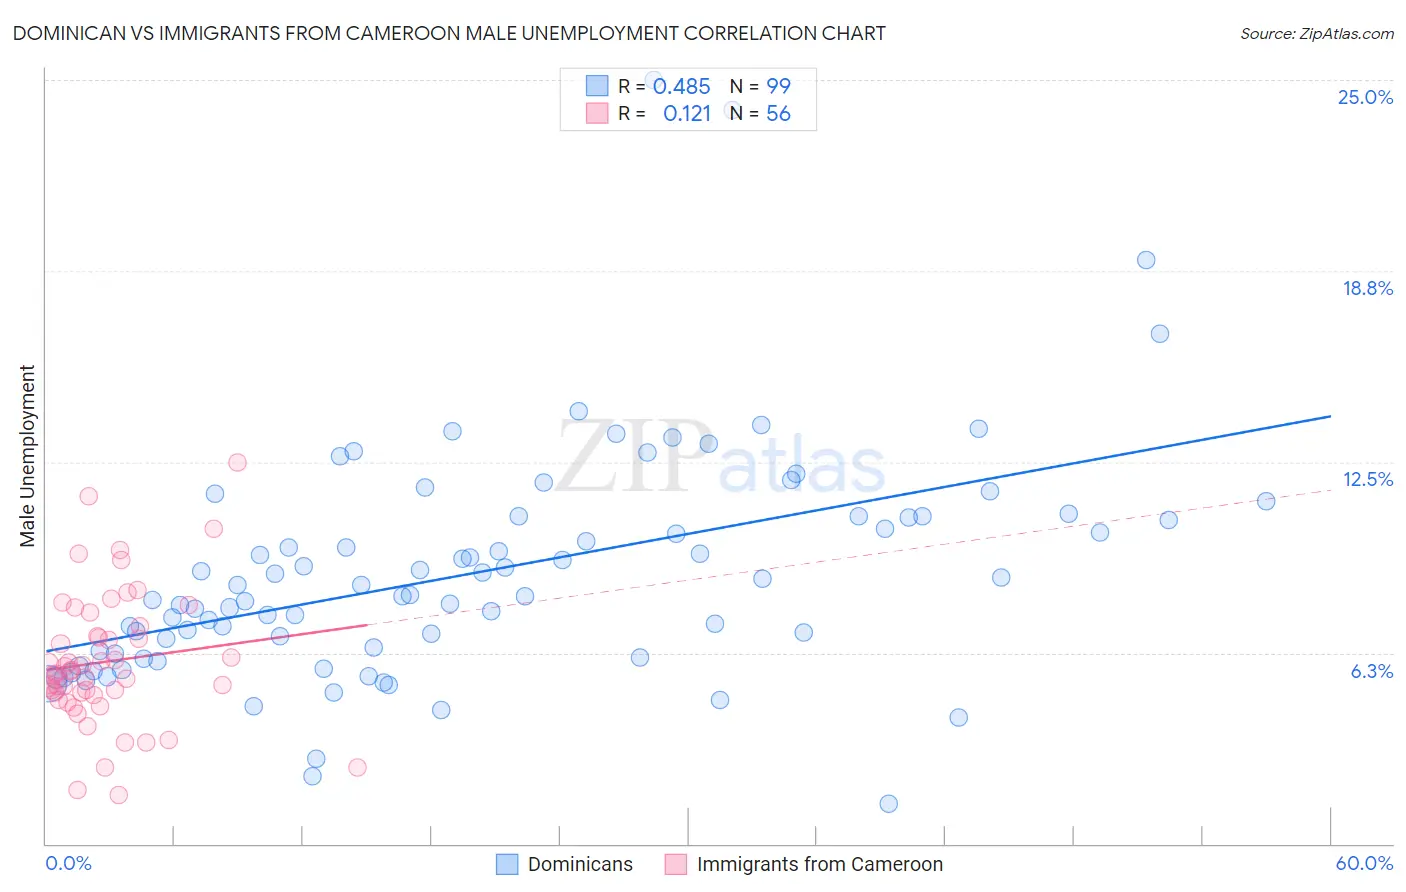
Dominican vs Immigrants from Cameroon Male Unemployment Correlation Chart
The statistical analysis conducted on geographies consisting of 353,678,027 people shows a moderate positive correlation between the proportion of Dominicans and unemployment rate among males in the United States with a correlation coefficient (R) of 0.485 and weighted average of 7.6%. Similarly, the statistical analysis conducted on geographies consisting of 130,586,445 people shows a poor positive correlation between the proportion of Immigrants from Cameroon and unemployment rate among males in the United States with a correlation coefficient (R) of 0.121 and weighted average of 5.6%, a difference of 34.1%.
Male Unemployment Correlation Summary
| Measurement | Dominican | Immigrants from Cameroon |
| Minimum | 1.3% | 1.6% |
| Maximum | 25.0% | 12.5% |
| Range | 23.7% | 10.9% |
| Mean | 8.9% | 6.0% |
| Median | 8.1% | 5.6% |
| Interquartile 25% (IQ1) | 6.2% | 4.9% |
| Interquartile 75% (IQ3) | 10.7% | 7.0% |
| Interquartile Range (IQR) | 4.5% | 2.0% |
| Standard Deviation (Sample) | 3.8% | 2.2% |
| Standard Deviation (Population) | 3.8% | 2.2% |
Similar Demographics by Male Unemployment
Demographics Similar to Dominicans by Male Unemployment
In terms of male unemployment, the demographic groups most similar to Dominicans are Immigrants from Grenada (7.6%, a difference of 0.27%), Shoshone (7.6%, a difference of 0.37%), Immigrants from Dominican Republic (7.6%, a difference of 0.48%), Immigrants from Cabo Verde (7.5%, a difference of 1.1%), and Immigrants from St. Vincent and the Grenadines (7.5%, a difference of 1.4%).
| Demographics | Rating | Rank | Male Unemployment |
| Guyanese | 0.0 /100 | #317 | Tragic 7.1% |
| Cape Verdeans | 0.0 /100 | #318 | Tragic 7.1% |
| British West Indians | 0.0 /100 | #319 | Tragic 7.3% |
| Colville | 0.0 /100 | #320 | Tragic 7.4% |
| Immigrants | St. Vincent and the Grenadines | 0.0 /100 | #321 | Tragic 7.5% |
| Immigrants | Cabo Verde | 0.0 /100 | #322 | Tragic 7.5% |
| Immigrants | Grenada | 0.0 /100 | #323 | Tragic 7.6% |
| Dominicans | 0.0 /100 | #324 | Tragic 7.6% |
| Shoshone | 0.0 /100 | #325 | Tragic 7.6% |
| Immigrants | Dominican Republic | 0.0 /100 | #326 | Tragic 7.6% |
| Paiute | 0.0 /100 | #327 | Tragic 7.7% |
| Natives/Alaskans | 0.0 /100 | #328 | Tragic 7.7% |
| Immigrants | Yemen | 0.0 /100 | #329 | Tragic 7.8% |
| Yakama | 0.0 /100 | #330 | Tragic 7.9% |
| Alaska Natives | 0.0 /100 | #331 | Tragic 8.1% |
Demographics Similar to Immigrants from Cameroon by Male Unemployment
In terms of male unemployment, the demographic groups most similar to Immigrants from Cameroon are Salvadoran (5.7%, a difference of 0.040%), Native Hawaiian (5.6%, a difference of 0.070%), Immigrants from Guatemala (5.6%, a difference of 0.070%), Ottawa (5.7%, a difference of 0.11%), and Honduran (5.6%, a difference of 0.12%).
| Demographics | Rating | Rank | Male Unemployment |
| Somalis | 1.5 /100 | #233 | Tragic 5.6% |
| Immigrants | Somalia | 1.5 /100 | #234 | Tragic 5.6% |
| Immigrants | Honduras | 1.5 /100 | #235 | Tragic 5.6% |
| Guatemalans | 1.2 /100 | #236 | Tragic 5.6% |
| Hondurans | 1.1 /100 | #237 | Tragic 5.6% |
| Native Hawaiians | 1.1 /100 | #238 | Tragic 5.6% |
| Immigrants | Guatemala | 1.1 /100 | #239 | Tragic 5.6% |
| Immigrants | Cameroon | 1.0 /100 | #240 | Tragic 5.6% |
| Salvadorans | 1.0 /100 | #241 | Tragic 5.7% |
| Ottawa | 0.9 /100 | #242 | Tragic 5.7% |
| Bangladeshis | 0.8 /100 | #243 | Tragic 5.7% |
| Immigrants | El Salvador | 0.7 /100 | #244 | Tragic 5.7% |
| Yaqui | 0.7 /100 | #245 | Tragic 5.7% |
| Iroquois | 0.6 /100 | #246 | Tragic 5.7% |
| Hawaiians | 0.6 /100 | #247 | Tragic 5.7% |