Liberian vs Australian Male Unemployment
COMPARE
Liberian
Australian
Male Unemployment
Male Unemployment Comparison
Liberians
Australians
5.8%
MALE UNEMPLOYMENT
0.1/ 100
METRIC RATING
261st/ 347
METRIC RANK
5.0%
MALE UNEMPLOYMENT
97.4/ 100
METRIC RATING
68th/ 347
METRIC RANK
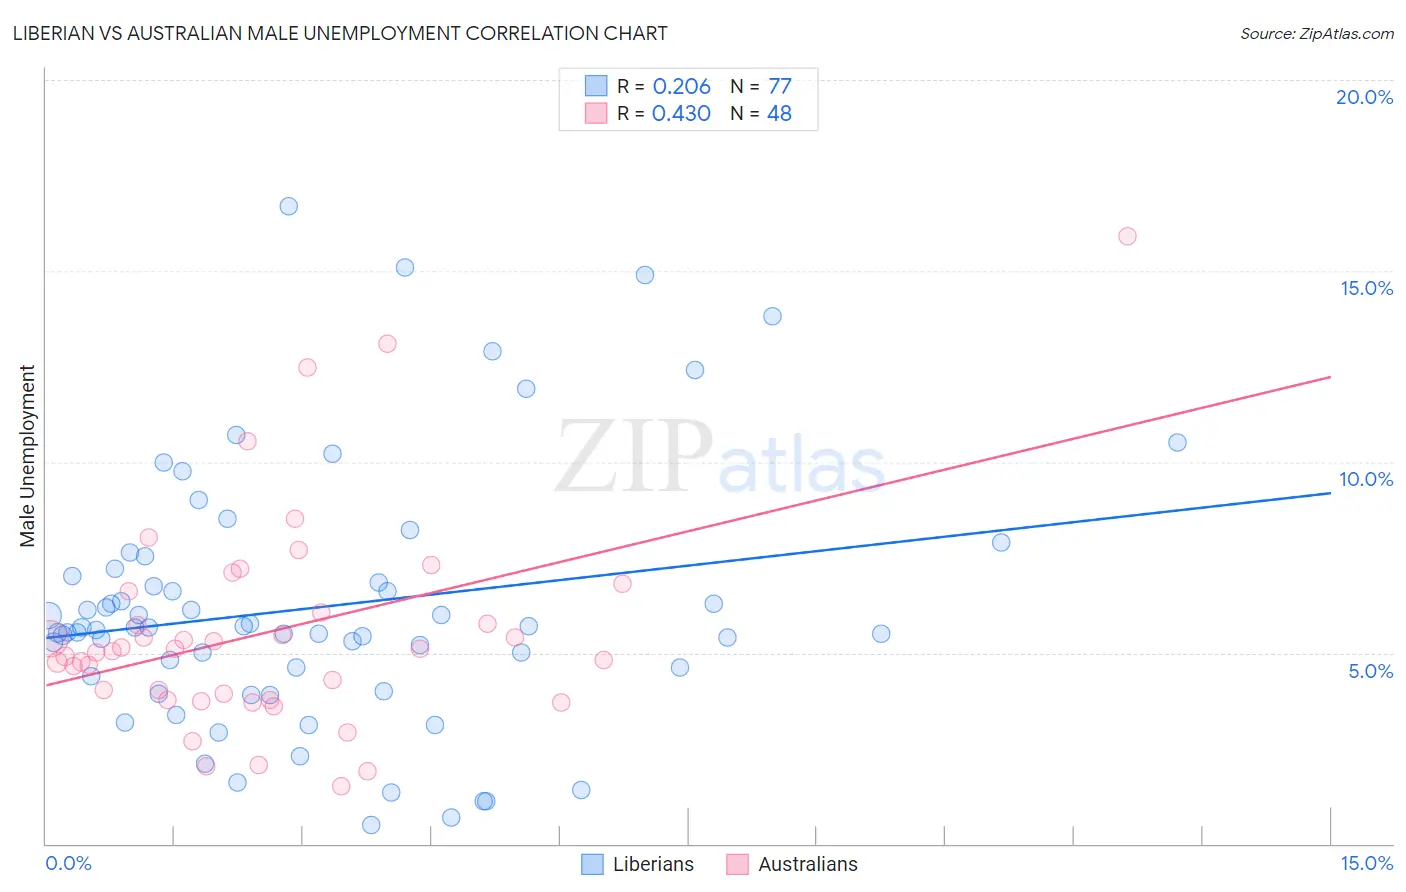
Liberian vs Australian Male Unemployment Correlation Chart
The statistical analysis conducted on geographies consisting of 117,984,986 people shows a weak positive correlation between the proportion of Liberians and unemployment rate among males in the United States with a correlation coefficient (R) of 0.206 and weighted average of 5.8%. Similarly, the statistical analysis conducted on geographies consisting of 223,647,847 people shows a moderate positive correlation between the proportion of Australians and unemployment rate among males in the United States with a correlation coefficient (R) of 0.430 and weighted average of 5.0%, a difference of 16.3%.
Male Unemployment Correlation Summary
| Measurement | Liberian | Australian |
| Minimum | 0.50% | 1.5% |
| Maximum | 16.7% | 15.9% |
| Range | 16.2% | 14.4% |
| Mean | 6.2% | 5.6% |
| Median | 5.7% | 5.1% |
| Interquartile 25% (IQ1) | 4.5% | 3.8% |
| Interquartile 75% (IQ3) | 7.1% | 6.3% |
| Interquartile Range (IQR) | 2.6% | 2.5% |
| Standard Deviation (Sample) | 3.3% | 2.8% |
| Standard Deviation (Population) | 3.3% | 2.8% |
Similar Demographics by Male Unemployment
Demographics Similar to Liberians by Male Unemployment
In terms of male unemployment, the demographic groups most similar to Liberians are Immigrants from Central America (5.8%, a difference of 0.18%), Cajun (5.8%, a difference of 0.24%), Dutch West Indian (5.8%, a difference of 0.39%), Immigrants from Portugal (5.9%, a difference of 0.45%), and Hispanic or Latino (5.8%, a difference of 0.53%).
| Demographics | Rating | Rank | Male Unemployment |
| Japanese | 0.2 /100 | #254 | Tragic 5.8% |
| Kiowa | 0.2 /100 | #255 | Tragic 5.8% |
| Comanche | 0.2 /100 | #256 | Tragic 5.8% |
| Hispanics or Latinos | 0.1 /100 | #257 | Tragic 5.8% |
| Dutch West Indians | 0.1 /100 | #258 | Tragic 5.8% |
| Cajuns | 0.1 /100 | #259 | Tragic 5.8% |
| Immigrants | Central America | 0.1 /100 | #260 | Tragic 5.8% |
| Liberians | 0.1 /100 | #261 | Tragic 5.8% |
| Immigrants | Portugal | 0.1 /100 | #262 | Tragic 5.9% |
| Immigrants | Latin America | 0.1 /100 | #263 | Tragic 5.9% |
| Immigrants | Mexico | 0.0 /100 | #264 | Tragic 5.9% |
| French American Indians | 0.0 /100 | #265 | Tragic 5.9% |
| Bahamians | 0.0 /100 | #266 | Tragic 5.9% |
| Nigerians | 0.0 /100 | #267 | Tragic 5.9% |
| Bermudans | 0.0 /100 | #268 | Tragic 5.9% |
Demographics Similar to Australians by Male Unemployment
In terms of male unemployment, the demographic groups most similar to Australians are Immigrants from Canada (5.0%, a difference of 0.010%), Finnish (5.0%, a difference of 0.030%), Immigrants from Sweden (5.0%, a difference of 0.030%), White/Caucasian (5.0%, a difference of 0.080%), and New Zealander (5.0%, a difference of 0.10%).
| Demographics | Rating | Rank | Male Unemployment |
| Cambodians | 98.1 /100 | #61 | Exceptional 5.0% |
| Basques | 97.9 /100 | #62 | Exceptional 5.0% |
| Eastern Europeans | 97.9 /100 | #63 | Exceptional 5.0% |
| Celtics | 97.8 /100 | #64 | Exceptional 5.0% |
| Icelanders | 97.6 /100 | #65 | Exceptional 5.0% |
| Finns | 97.5 /100 | #66 | Exceptional 5.0% |
| Immigrants | Canada | 97.5 /100 | #67 | Exceptional 5.0% |
| Australians | 97.4 /100 | #68 | Exceptional 5.0% |
| Immigrants | Sweden | 97.4 /100 | #69 | Exceptional 5.0% |
| Whites/Caucasians | 97.3 /100 | #70 | Exceptional 5.0% |
| New Zealanders | 97.3 /100 | #71 | Exceptional 5.0% |
| Immigrants | South Africa | 97.1 /100 | #72 | Exceptional 5.0% |
| Greeks | 97.0 /100 | #73 | Exceptional 5.0% |
| Immigrants | North America | 96.9 /100 | #74 | Exceptional 5.0% |
| Assyrians/Chaldeans/Syriacs | 96.9 /100 | #75 | Exceptional 5.0% |