Liberian vs Immigrants from Cuba Male Unemployment
COMPARE
Liberian
Immigrants from Cuba
Male Unemployment
Male Unemployment Comparison
Liberians
Immigrants from Cuba
5.8%
MALE UNEMPLOYMENT
0.1/ 100
METRIC RATING
261st/ 347
METRIC RANK
4.4%
MALE UNEMPLOYMENT
100.0/ 100
METRIC RATING
2nd/ 347
METRIC RANK
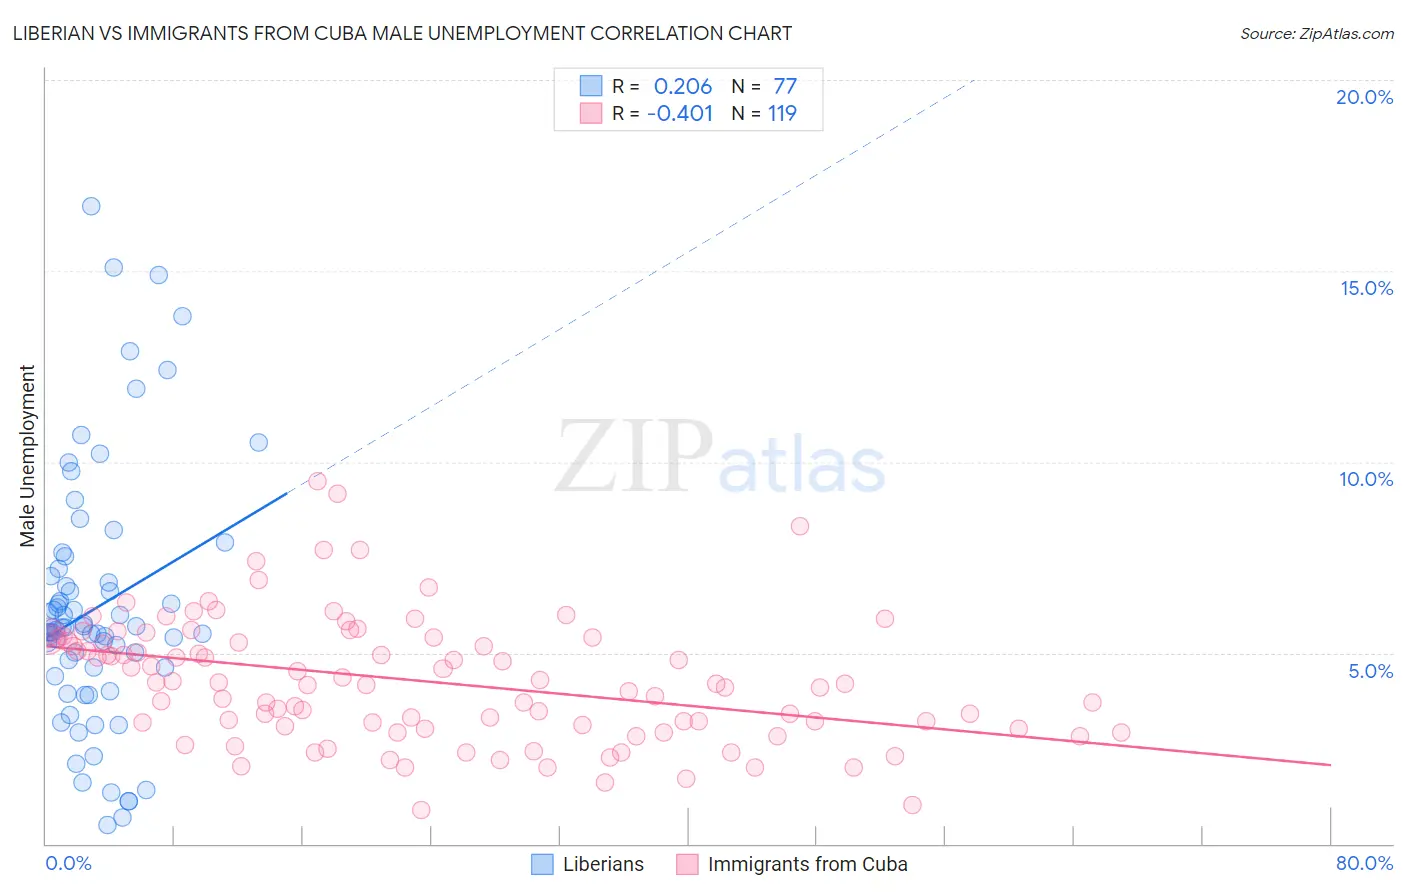
Liberian vs Immigrants from Cuba Male Unemployment Correlation Chart
The statistical analysis conducted on geographies consisting of 117,984,986 people shows a weak positive correlation between the proportion of Liberians and unemployment rate among males in the United States with a correlation coefficient (R) of 0.206 and weighted average of 5.8%. Similarly, the statistical analysis conducted on geographies consisting of 325,045,859 people shows a moderate negative correlation between the proportion of Immigrants from Cuba and unemployment rate among males in the United States with a correlation coefficient (R) of -0.401 and weighted average of 4.4%, a difference of 31.9%.
Male Unemployment Correlation Summary
| Measurement | Liberian | Immigrants from Cuba |
| Minimum | 0.50% | 0.90% |
| Maximum | 16.7% | 9.5% |
| Range | 16.2% | 8.6% |
| Mean | 6.2% | 4.3% |
| Median | 5.7% | 4.2% |
| Interquartile 25% (IQ1) | 4.5% | 3.1% |
| Interquartile 75% (IQ3) | 7.1% | 5.4% |
| Interquartile Range (IQR) | 2.6% | 2.3% |
| Standard Deviation (Sample) | 3.3% | 1.6% |
| Standard Deviation (Population) | 3.3% | 1.6% |
Similar Demographics by Male Unemployment
Demographics Similar to Liberians by Male Unemployment
In terms of male unemployment, the demographic groups most similar to Liberians are Immigrants from Central America (5.8%, a difference of 0.18%), Cajun (5.8%, a difference of 0.24%), Dutch West Indian (5.8%, a difference of 0.39%), Immigrants from Portugal (5.9%, a difference of 0.45%), and Hispanic or Latino (5.8%, a difference of 0.53%).
| Demographics | Rating | Rank | Male Unemployment |
| Japanese | 0.2 /100 | #254 | Tragic 5.8% |
| Kiowa | 0.2 /100 | #255 | Tragic 5.8% |
| Comanche | 0.2 /100 | #256 | Tragic 5.8% |
| Hispanics or Latinos | 0.1 /100 | #257 | Tragic 5.8% |
| Dutch West Indians | 0.1 /100 | #258 | Tragic 5.8% |
| Cajuns | 0.1 /100 | #259 | Tragic 5.8% |
| Immigrants | Central America | 0.1 /100 | #260 | Tragic 5.8% |
| Liberians | 0.1 /100 | #261 | Tragic 5.8% |
| Immigrants | Portugal | 0.1 /100 | #262 | Tragic 5.9% |
| Immigrants | Latin America | 0.1 /100 | #263 | Tragic 5.9% |
| Immigrants | Mexico | 0.0 /100 | #264 | Tragic 5.9% |
| French American Indians | 0.0 /100 | #265 | Tragic 5.9% |
| Bahamians | 0.0 /100 | #266 | Tragic 5.9% |
| Nigerians | 0.0 /100 | #267 | Tragic 5.9% |
| Bermudans | 0.0 /100 | #268 | Tragic 5.9% |
Demographics Similar to Immigrants from Cuba by Male Unemployment
In terms of male unemployment, the demographic groups most similar to Immigrants from Cuba are Norwegian (4.4%, a difference of 0.24%), Immigrants from Venezuela (4.4%, a difference of 0.58%), Immigrants from India (4.4%, a difference of 1.1%), Danish (4.5%, a difference of 1.6%), and Venezuelan (4.5%, a difference of 2.1%).
| Demographics | Rating | Rank | Male Unemployment |
| Immigrants | India | 100.0 /100 | #1 | Exceptional 4.4% |
| Immigrants | Cuba | 100.0 /100 | #2 | Exceptional 4.4% |
| Norwegians | 100.0 /100 | #3 | Exceptional 4.4% |
| Immigrants | Venezuela | 100.0 /100 | #4 | Exceptional 4.4% |
| Danes | 100.0 /100 | #5 | Exceptional 4.5% |
| Venezuelans | 100.0 /100 | #6 | Exceptional 4.5% |
| Czechs | 100.0 /100 | #7 | Exceptional 4.5% |
| Luxembourgers | 100.0 /100 | #8 | Exceptional 4.5% |
| Thais | 100.0 /100 | #9 | Exceptional 4.6% |
| Cubans | 100.0 /100 | #10 | Exceptional 4.6% |
| Swedes | 100.0 /100 | #11 | Exceptional 4.6% |
| Immigrants | Bolivia | 100.0 /100 | #12 | Exceptional 4.7% |
| Bolivians | 100.0 /100 | #13 | Exceptional 4.7% |
| Germans | 100.0 /100 | #14 | Exceptional 4.7% |
| Scandinavians | 100.0 /100 | #15 | Exceptional 4.7% |