Belizean vs Immigrants from Cameroon Male Unemployment
COMPARE
Belizean
Immigrants from Cameroon
Male Unemployment
Male Unemployment Comparison
Belizeans
Immigrants from Cameroon
6.5%
MALE UNEMPLOYMENT
0.0/ 100
METRIC RATING
295th/ 347
METRIC RANK
5.6%
MALE UNEMPLOYMENT
1.0/ 100
METRIC RATING
240th/ 347
METRIC RANK
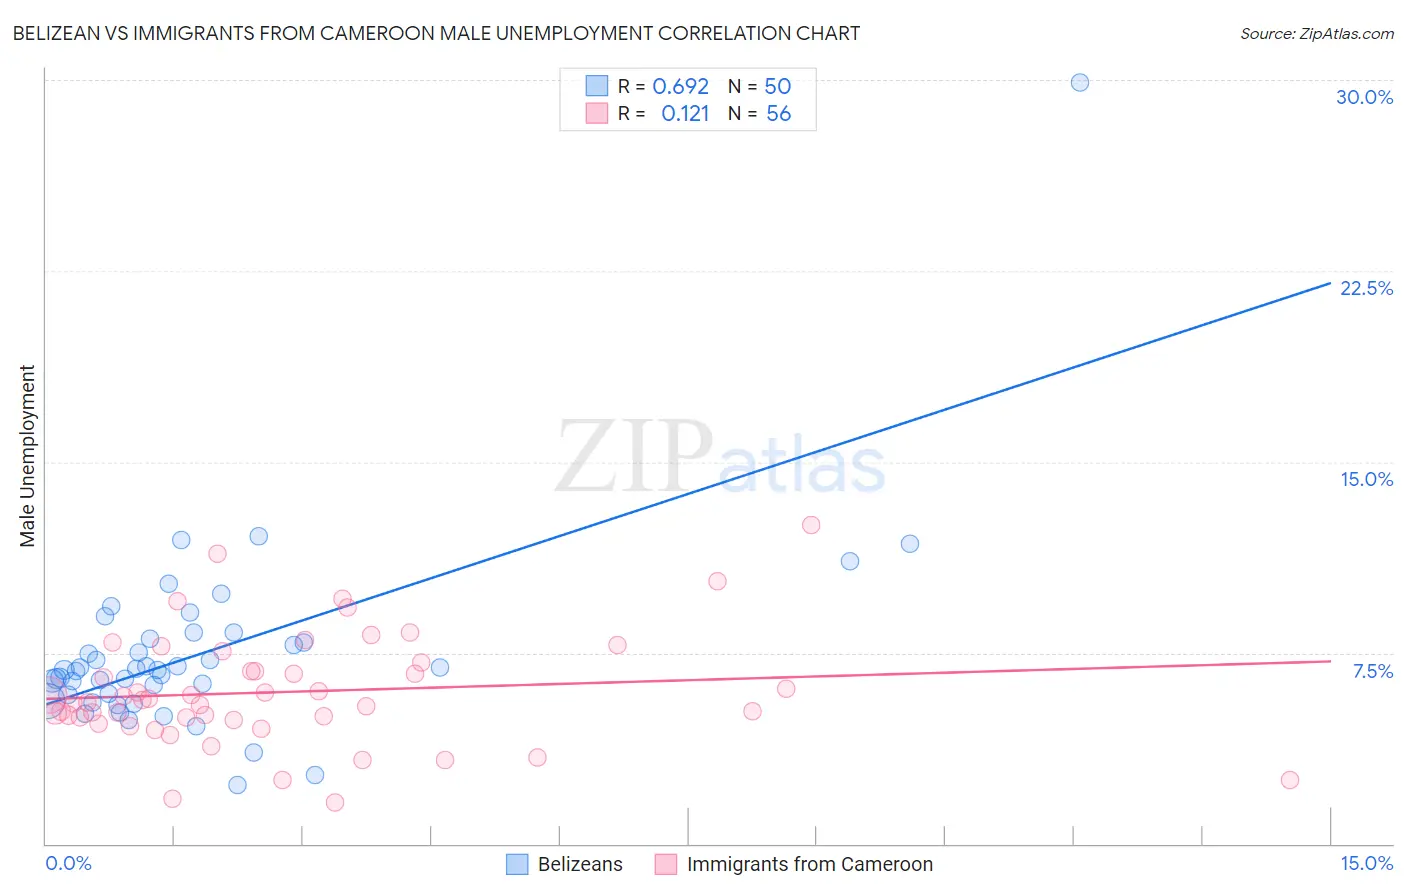
Belizean vs Immigrants from Cameroon Male Unemployment Correlation Chart
The statistical analysis conducted on geographies consisting of 144,079,260 people shows a significant positive correlation between the proportion of Belizeans and unemployment rate among males in the United States with a correlation coefficient (R) of 0.692 and weighted average of 6.5%. Similarly, the statistical analysis conducted on geographies consisting of 130,586,445 people shows a poor positive correlation between the proportion of Immigrants from Cameroon and unemployment rate among males in the United States with a correlation coefficient (R) of 0.121 and weighted average of 5.6%, a difference of 15.1%.
Male Unemployment Correlation Summary
| Measurement | Belizean | Immigrants from Cameroon |
| Minimum | 2.3% | 1.6% |
| Maximum | 29.9% | 12.5% |
| Range | 27.6% | 10.9% |
| Mean | 7.5% | 6.0% |
| Median | 6.8% | 5.6% |
| Interquartile 25% (IQ1) | 5.8% | 4.9% |
| Interquartile 75% (IQ3) | 8.1% | 7.0% |
| Interquartile Range (IQR) | 2.2% | 2.0% |
| Standard Deviation (Sample) | 3.9% | 2.2% |
| Standard Deviation (Population) | 3.8% | 2.2% |
Similar Demographics by Male Unemployment
Demographics Similar to Belizeans by Male Unemployment
In terms of male unemployment, the demographic groups most similar to Belizeans are Immigrants from Haiti (6.5%, a difference of 0.45%), Chippewa (6.6%, a difference of 0.77%), Senegalese (6.4%, a difference of 0.85%), Jamaican (6.6%, a difference of 0.85%), and Haitian (6.4%, a difference of 0.96%).
| Demographics | Rating | Rank | Male Unemployment |
| Immigrants | Senegal | 0.0 /100 | #288 | Tragic 6.3% |
| Immigrants | Caribbean | 0.0 /100 | #289 | Tragic 6.3% |
| U.S. Virgin Islanders | 0.0 /100 | #290 | Tragic 6.4% |
| Immigrants | Azores | 0.0 /100 | #291 | Tragic 6.4% |
| Nepalese | 0.0 /100 | #292 | Tragic 6.4% |
| Haitians | 0.0 /100 | #293 | Tragic 6.4% |
| Senegalese | 0.0 /100 | #294 | Tragic 6.4% |
| Belizeans | 0.0 /100 | #295 | Tragic 6.5% |
| Immigrants | Haiti | 0.0 /100 | #296 | Tragic 6.5% |
| Chippewa | 0.0 /100 | #297 | Tragic 6.6% |
| Jamaicans | 0.0 /100 | #298 | Tragic 6.6% |
| Immigrants | Bangladesh | 0.0 /100 | #299 | Tragic 6.6% |
| Vietnamese | 0.0 /100 | #300 | Tragic 6.6% |
| Immigrants | Belize | 0.0 /100 | #301 | Tragic 6.6% |
| Ute | 0.0 /100 | #302 | Tragic 6.6% |
Demographics Similar to Immigrants from Cameroon by Male Unemployment
In terms of male unemployment, the demographic groups most similar to Immigrants from Cameroon are Salvadoran (5.7%, a difference of 0.040%), Native Hawaiian (5.6%, a difference of 0.070%), Immigrants from Guatemala (5.6%, a difference of 0.070%), Ottawa (5.7%, a difference of 0.11%), and Honduran (5.6%, a difference of 0.12%).
| Demographics | Rating | Rank | Male Unemployment |
| Somalis | 1.5 /100 | #233 | Tragic 5.6% |
| Immigrants | Somalia | 1.5 /100 | #234 | Tragic 5.6% |
| Immigrants | Honduras | 1.5 /100 | #235 | Tragic 5.6% |
| Guatemalans | 1.2 /100 | #236 | Tragic 5.6% |
| Hondurans | 1.1 /100 | #237 | Tragic 5.6% |
| Native Hawaiians | 1.1 /100 | #238 | Tragic 5.6% |
| Immigrants | Guatemala | 1.1 /100 | #239 | Tragic 5.6% |
| Immigrants | Cameroon | 1.0 /100 | #240 | Tragic 5.6% |
| Salvadorans | 1.0 /100 | #241 | Tragic 5.7% |
| Ottawa | 0.9 /100 | #242 | Tragic 5.7% |
| Bangladeshis | 0.8 /100 | #243 | Tragic 5.7% |
| Immigrants | El Salvador | 0.7 /100 | #244 | Tragic 5.7% |
| Yaqui | 0.7 /100 | #245 | Tragic 5.7% |
| Iroquois | 0.6 /100 | #246 | Tragic 5.7% |
| Hawaiians | 0.6 /100 | #247 | Tragic 5.7% |