Korean vs Indian (Asian) Disability Age 18 to 34
COMPARE
Korean
Indian (Asian)
Disability Age 18 to 34
Disability Age 18 to 34 Comparison
Koreans
Indians (Asian)
6.3%
DISABILITY AGE 18 TO 34
94.1/ 100
METRIC RATING
115th/ 347
METRIC RANK
5.5%
DISABILITY AGE 18 TO 34
100.0/ 100
METRIC RATING
14th/ 347
METRIC RANK
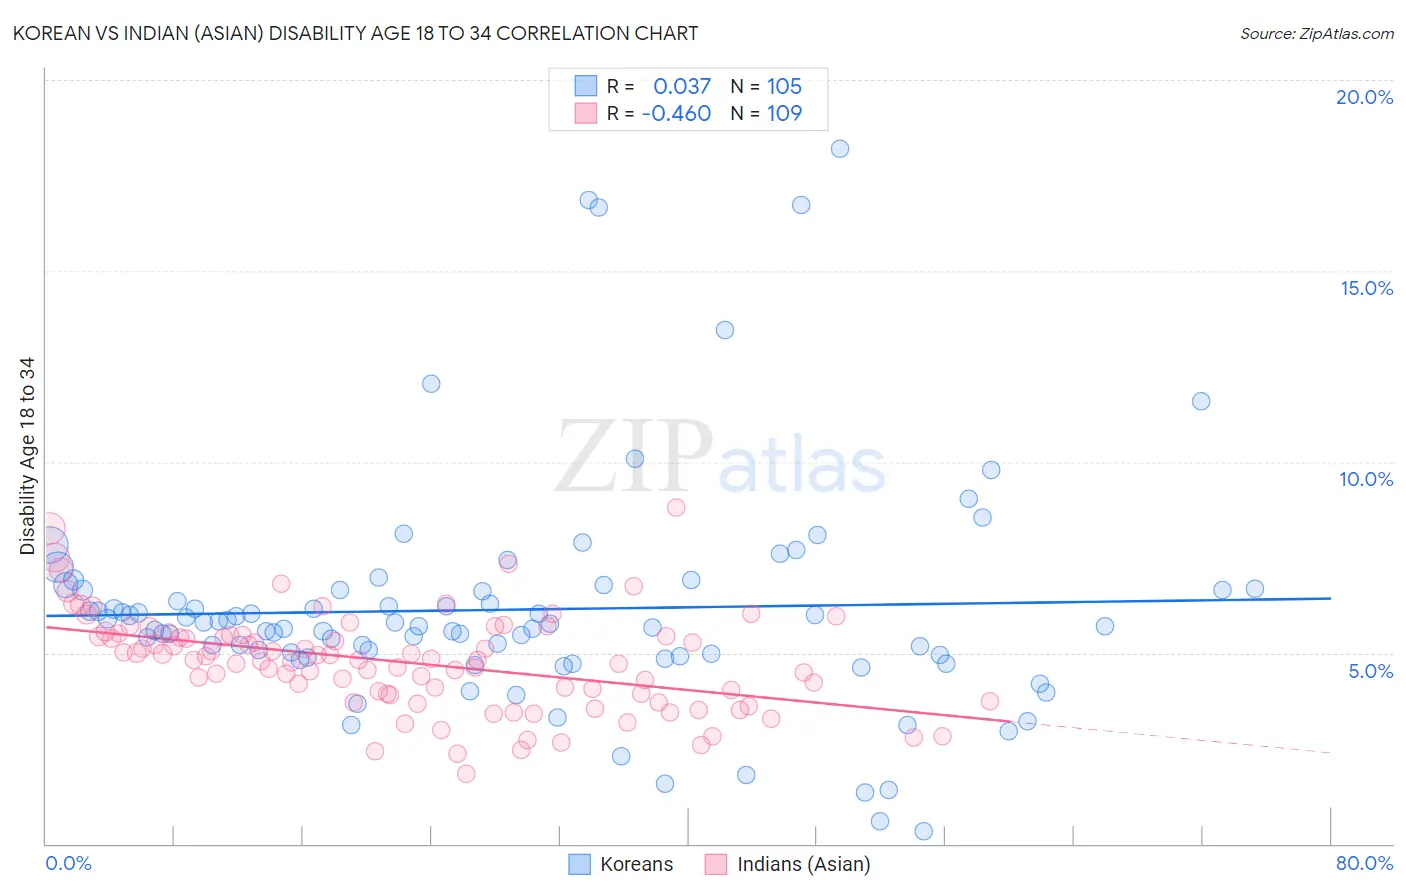
Korean vs Indian (Asian) Disability Age 18 to 34 Correlation Chart
The statistical analysis conducted on geographies consisting of 508,804,604 people shows no correlation between the proportion of Koreans and percentage of population with a disability between the ages 18 and 35 in the United States with a correlation coefficient (R) of 0.037 and weighted average of 6.3%. Similarly, the statistical analysis conducted on geographies consisting of 493,463,376 people shows a moderate negative correlation between the proportion of Indians (Asian) and percentage of population with a disability between the ages 18 and 35 in the United States with a correlation coefficient (R) of -0.460 and weighted average of 5.5%, a difference of 13.2%.
Disability Age 18 to 34 Correlation Summary
| Measurement | Korean | Indian (Asian) |
| Minimum | 0.34% | 1.8% |
| Maximum | 18.2% | 8.8% |
| Range | 17.9% | 7.0% |
| Mean | 6.1% | 4.8% |
| Median | 5.7% | 4.8% |
| Interquartile 25% (IQ1) | 4.9% | 3.9% |
| Interquartile 75% (IQ3) | 6.6% | 5.5% |
| Interquartile Range (IQR) | 1.7% | 1.6% |
| Standard Deviation (Sample) | 3.0% | 1.3% |
| Standard Deviation (Population) | 3.0% | 1.3% |
Similar Demographics by Disability Age 18 to 34
Demographics Similar to Koreans by Disability Age 18 to 34
In terms of disability age 18 to 34, the demographic groups most similar to Koreans are Immigrants from Costa Rica (6.3%, a difference of 0.030%), Immigrants from Jordan (6.3%, a difference of 0.030%), Immigrants from South Eastern Asia (6.3%, a difference of 0.12%), Immigrants from Nepal (6.3%, a difference of 0.13%), and Chilean (6.3%, a difference of 0.18%).
| Demographics | Rating | Rank | Disability Age 18 to 34 |
| Immigrants | Croatia | 95.7 /100 | #108 | Exceptional 6.2% |
| Sri Lankans | 95.5 /100 | #109 | Exceptional 6.2% |
| Immigrants | Brazil | 95.2 /100 | #110 | Exceptional 6.3% |
| Immigrants | France | 95.1 /100 | #111 | Exceptional 6.3% |
| Immigrants | Romania | 94.9 /100 | #112 | Exceptional 6.3% |
| Immigrants | Latin America | 94.9 /100 | #113 | Exceptional 6.3% |
| Immigrants | South Eastern Asia | 94.4 /100 | #114 | Exceptional 6.3% |
| Koreans | 94.1 /100 | #115 | Exceptional 6.3% |
| Immigrants | Costa Rica | 94.0 /100 | #116 | Exceptional 6.3% |
| Immigrants | Jordan | 94.0 /100 | #117 | Exceptional 6.3% |
| Immigrants | Nepal | 93.7 /100 | #118 | Exceptional 6.3% |
| Chileans | 93.5 /100 | #119 | Exceptional 6.3% |
| Immigrants | Ukraine | 93.4 /100 | #120 | Exceptional 6.3% |
| Immigrants | Guatemala | 93.4 /100 | #121 | Exceptional 6.3% |
| Immigrants | Czechoslovakia | 93.3 /100 | #122 | Exceptional 6.3% |
Demographics Similar to Indians (Asian) by Disability Age 18 to 34
In terms of disability age 18 to 34, the demographic groups most similar to Indians (Asian) are Immigrants from Iran (5.5%, a difference of 0.15%), Immigrants from India (5.6%, a difference of 0.38%), Immigrants from Israel (5.6%, a difference of 0.41%), Immigrants from St. Vincent and the Grenadines (5.5%, a difference of 0.47%), and Vietnamese (5.5%, a difference of 0.53%).
| Demographics | Rating | Rank | Disability Age 18 to 34 |
| Immigrants | China | 100.0 /100 | #7 | Exceptional 5.4% |
| Immigrants | Guyana | 100.0 /100 | #8 | Exceptional 5.5% |
| Guyanese | 100.0 /100 | #9 | Exceptional 5.5% |
| Immigrants | Uzbekistan | 100.0 /100 | #10 | Exceptional 5.5% |
| Vietnamese | 100.0 /100 | #11 | Exceptional 5.5% |
| Immigrants | St. Vincent and the Grenadines | 100.0 /100 | #12 | Exceptional 5.5% |
| Immigrants | Iran | 100.0 /100 | #13 | Exceptional 5.5% |
| Indians (Asian) | 100.0 /100 | #14 | Exceptional 5.5% |
| Immigrants | India | 100.0 /100 | #15 | Exceptional 5.6% |
| Immigrants | Israel | 100.0 /100 | #16 | Exceptional 5.6% |
| Immigrants | Eastern Asia | 100.0 /100 | #17 | Exceptional 5.6% |
| Immigrants | Bolivia | 100.0 /100 | #18 | Exceptional 5.6% |
| Thais | 100.0 /100 | #19 | Exceptional 5.6% |
| Immigrants | Bangladesh | 100.0 /100 | #20 | Exceptional 5.6% |
| Immigrants | South Central Asia | 100.0 /100 | #21 | Exceptional 5.7% |