Japanese vs Immigrants from Vietnam Male Unemployment
COMPARE
Japanese
Immigrants from Vietnam
Male Unemployment
Male Unemployment Comparison
Japanese
Immigrants from Vietnam
5.8%
MALE UNEMPLOYMENT
0.2/ 100
METRIC RATING
254th/ 347
METRIC RANK
5.3%
MALE UNEMPLOYMENT
58.1/ 100
METRIC RATING
167th/ 347
METRIC RANK
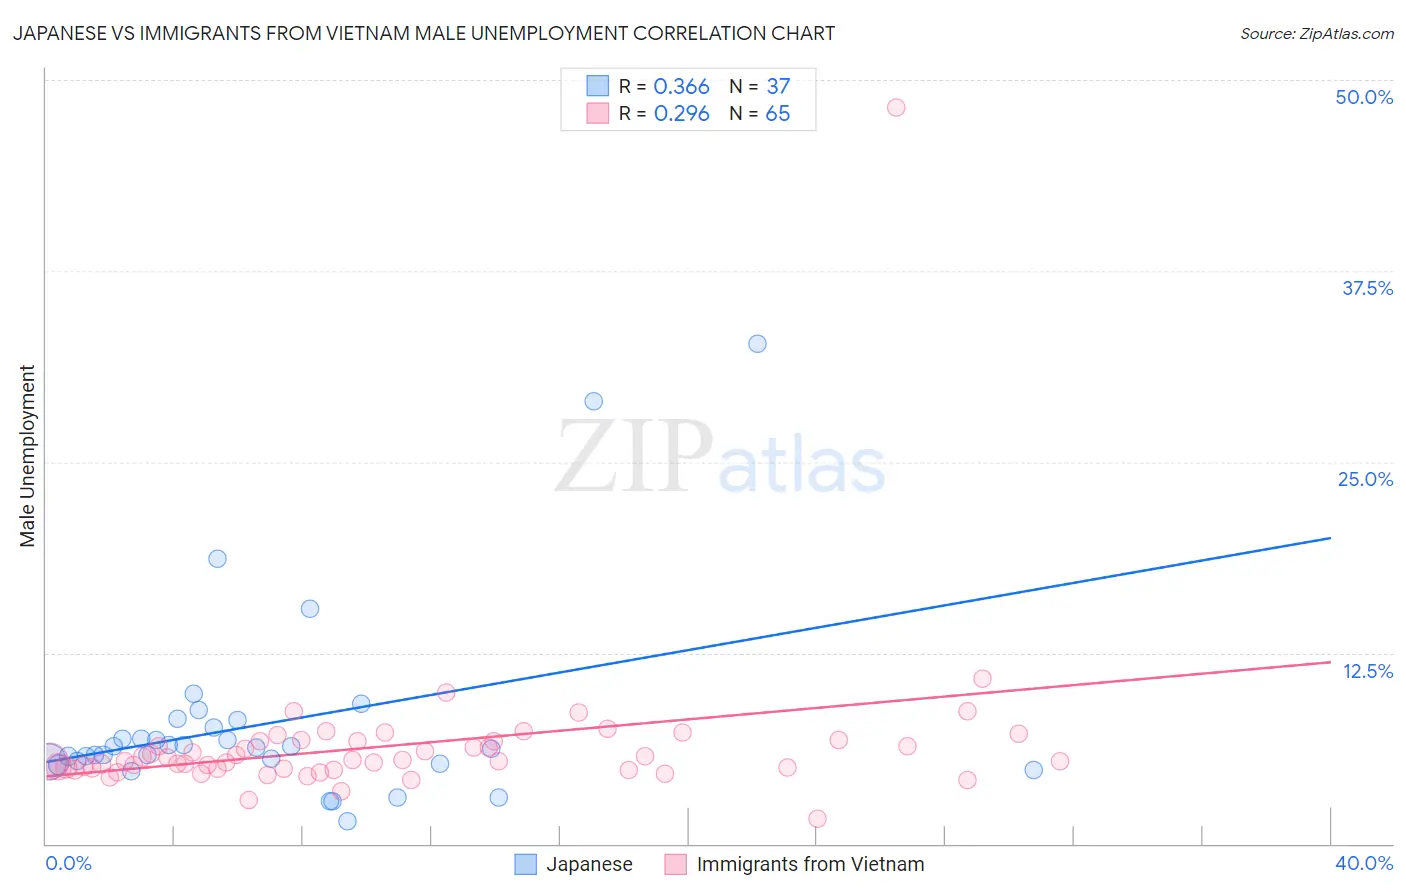
Japanese vs Immigrants from Vietnam Male Unemployment Correlation Chart
The statistical analysis conducted on geographies consisting of 248,784,678 people shows a mild positive correlation between the proportion of Japanese and unemployment rate among males in the United States with a correlation coefficient (R) of 0.366 and weighted average of 5.8%. Similarly, the statistical analysis conducted on geographies consisting of 403,387,433 people shows a weak positive correlation between the proportion of Immigrants from Vietnam and unemployment rate among males in the United States with a correlation coefficient (R) of 0.296 and weighted average of 5.3%, a difference of 9.7%.
Male Unemployment Correlation Summary
| Measurement | Japanese | Immigrants from Vietnam |
| Minimum | 1.5% | 1.6% |
| Maximum | 32.7% | 48.2% |
| Range | 31.2% | 46.6% |
| Mean | 7.9% | 6.4% |
| Median | 6.3% | 5.4% |
| Interquartile 25% (IQ1) | 5.3% | 4.9% |
| Interquartile 75% (IQ3) | 7.9% | 6.7% |
| Interquartile Range (IQR) | 2.6% | 1.8% |
| Standard Deviation (Sample) | 6.4% | 5.5% |
| Standard Deviation (Population) | 6.3% | 5.4% |
Similar Demographics by Male Unemployment
Demographics Similar to Japanese by Male Unemployment
In terms of male unemployment, the demographic groups most similar to Japanese are Kiowa (5.8%, a difference of 0.10%), Mexican American Indian (5.8%, a difference of 0.17%), Comanche (5.8%, a difference of 0.18%), Mexican (5.8%, a difference of 0.30%), and Hispanic or Latino (5.8%, a difference of 0.35%).
| Demographics | Rating | Rank | Male Unemployment |
| Hawaiians | 0.6 /100 | #247 | Tragic 5.7% |
| Marshallese | 0.5 /100 | #248 | Tragic 5.7% |
| Cree | 0.4 /100 | #249 | Tragic 5.7% |
| Immigrants | Bahamas | 0.4 /100 | #250 | Tragic 5.7% |
| Spanish Americans | 0.3 /100 | #251 | Tragic 5.7% |
| Mexicans | 0.2 /100 | #252 | Tragic 5.8% |
| Mexican American Indians | 0.2 /100 | #253 | Tragic 5.8% |
| Japanese | 0.2 /100 | #254 | Tragic 5.8% |
| Kiowa | 0.2 /100 | #255 | Tragic 5.8% |
| Comanche | 0.2 /100 | #256 | Tragic 5.8% |
| Hispanics or Latinos | 0.1 /100 | #257 | Tragic 5.8% |
| Dutch West Indians | 0.1 /100 | #258 | Tragic 5.8% |
| Cajuns | 0.1 /100 | #259 | Tragic 5.8% |
| Immigrants | Central America | 0.1 /100 | #260 | Tragic 5.8% |
| Liberians | 0.1 /100 | #261 | Tragic 5.8% |
Demographics Similar to Immigrants from Vietnam by Male Unemployment
In terms of male unemployment, the demographic groups most similar to Immigrants from Vietnam are Immigrants from Ireland (5.3%, a difference of 0.020%), Immigrants from Congo (5.3%, a difference of 0.040%), Immigrants from Morocco (5.3%, a difference of 0.12%), South American (5.3%, a difference of 0.15%), and Afghan (5.3%, a difference of 0.23%).
| Demographics | Rating | Rank | Male Unemployment |
| Immigrants | Norway | 71.0 /100 | #160 | Good 5.2% |
| Immigrants | China | 70.6 /100 | #161 | Good 5.2% |
| Immigrants | Egypt | 65.9 /100 | #162 | Good 5.2% |
| Immigrants | Hong Kong | 65.7 /100 | #163 | Good 5.2% |
| Afghans | 62.0 /100 | #164 | Good 5.3% |
| South Americans | 60.6 /100 | #165 | Good 5.3% |
| Immigrants | Morocco | 60.2 /100 | #166 | Good 5.3% |
| Immigrants | Vietnam | 58.1 /100 | #167 | Average 5.3% |
| Immigrants | Ireland | 57.7 /100 | #168 | Average 5.3% |
| Immigrants | Congo | 57.4 /100 | #169 | Average 5.3% |
| Immigrants | Eastern Europe | 54.1 /100 | #170 | Average 5.3% |
| Peruvians | 51.9 /100 | #171 | Average 5.3% |
| Immigrants | Kazakhstan | 50.8 /100 | #172 | Average 5.3% |
| Immigrants | Russia | 50.7 /100 | #173 | Average 5.3% |
| Immigrants | Iran | 50.0 /100 | #174 | Average 5.3% |