Japanese vs Colombian Male Unemployment
COMPARE
Japanese
Colombian
Male Unemployment
Male Unemployment Comparison
Japanese
Colombians
5.8%
MALE UNEMPLOYMENT
0.2/ 100
METRIC RATING
254th/ 347
METRIC RANK
5.2%
MALE UNEMPLOYMENT
81.1/ 100
METRIC RATING
133rd/ 347
METRIC RANK
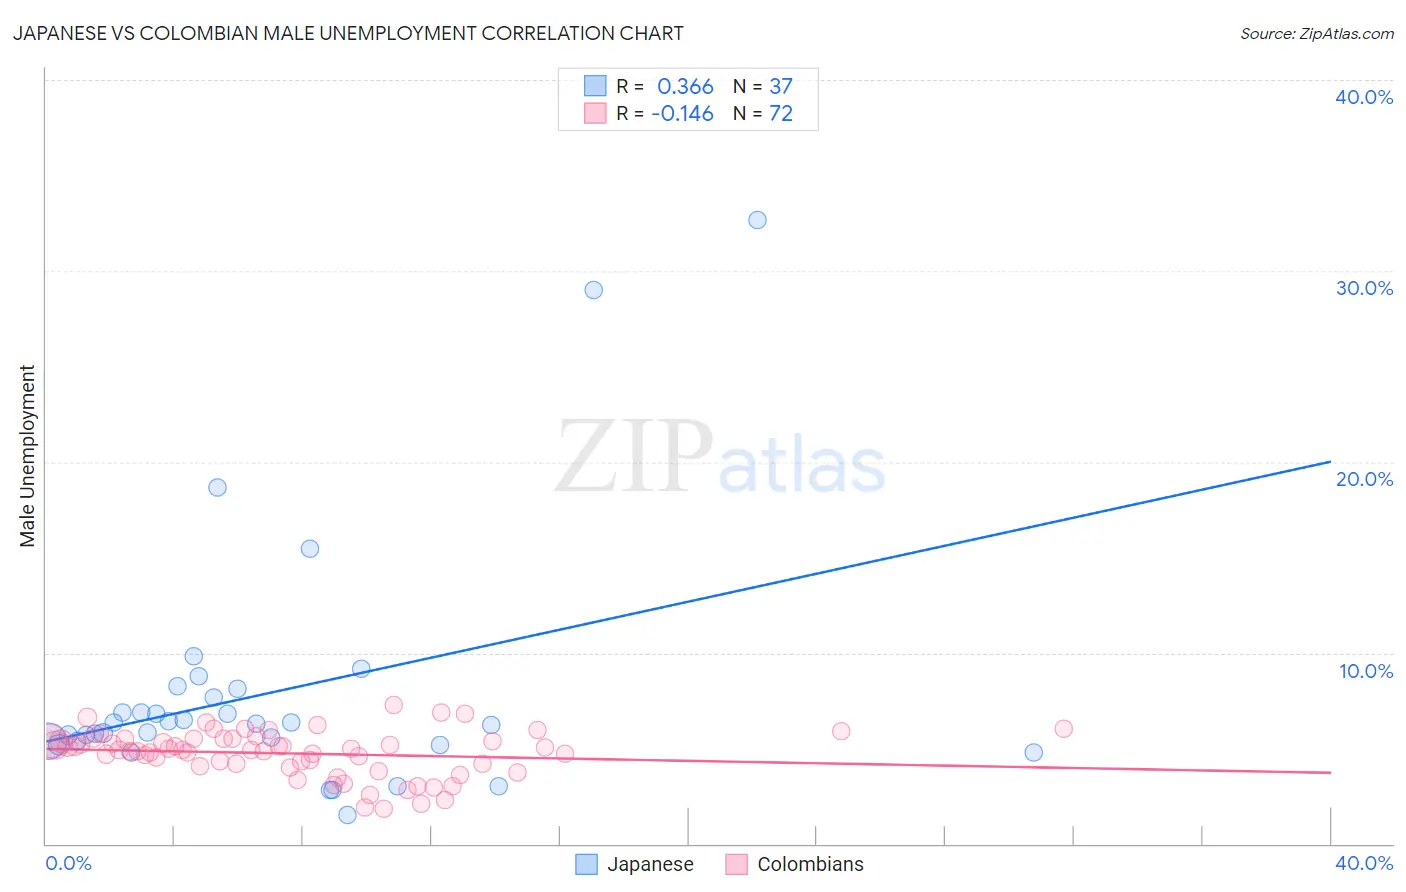
Japanese vs Colombian Male Unemployment Correlation Chart
The statistical analysis conducted on geographies consisting of 248,784,678 people shows a mild positive correlation between the proportion of Japanese and unemployment rate among males in the United States with a correlation coefficient (R) of 0.366 and weighted average of 5.8%. Similarly, the statistical analysis conducted on geographies consisting of 417,848,253 people shows a poor negative correlation between the proportion of Colombians and unemployment rate among males in the United States with a correlation coefficient (R) of -0.146 and weighted average of 5.2%, a difference of 11.6%.
Male Unemployment Correlation Summary
| Measurement | Japanese | Colombian |
| Minimum | 1.5% | 1.8% |
| Maximum | 32.7% | 7.3% |
| Range | 31.2% | 5.4% |
| Mean | 7.9% | 4.7% |
| Median | 6.3% | 4.9% |
| Interquartile 25% (IQ1) | 5.3% | 4.1% |
| Interquartile 75% (IQ3) | 7.9% | 5.5% |
| Interquartile Range (IQR) | 2.6% | 1.4% |
| Standard Deviation (Sample) | 6.4% | 1.2% |
| Standard Deviation (Population) | 6.3% | 1.2% |
Similar Demographics by Male Unemployment
Demographics Similar to Japanese by Male Unemployment
In terms of male unemployment, the demographic groups most similar to Japanese are Kiowa (5.8%, a difference of 0.10%), Mexican American Indian (5.8%, a difference of 0.17%), Comanche (5.8%, a difference of 0.18%), Mexican (5.8%, a difference of 0.30%), and Hispanic or Latino (5.8%, a difference of 0.35%).
| Demographics | Rating | Rank | Male Unemployment |
| Hawaiians | 0.6 /100 | #247 | Tragic 5.7% |
| Marshallese | 0.5 /100 | #248 | Tragic 5.7% |
| Cree | 0.4 /100 | #249 | Tragic 5.7% |
| Immigrants | Bahamas | 0.4 /100 | #250 | Tragic 5.7% |
| Spanish Americans | 0.3 /100 | #251 | Tragic 5.7% |
| Mexicans | 0.2 /100 | #252 | Tragic 5.8% |
| Mexican American Indians | 0.2 /100 | #253 | Tragic 5.8% |
| Japanese | 0.2 /100 | #254 | Tragic 5.8% |
| Kiowa | 0.2 /100 | #255 | Tragic 5.8% |
| Comanche | 0.2 /100 | #256 | Tragic 5.8% |
| Hispanics or Latinos | 0.1 /100 | #257 | Tragic 5.8% |
| Dutch West Indians | 0.1 /100 | #258 | Tragic 5.8% |
| Cajuns | 0.1 /100 | #259 | Tragic 5.8% |
| Immigrants | Central America | 0.1 /100 | #260 | Tragic 5.8% |
| Liberians | 0.1 /100 | #261 | Tragic 5.8% |
Demographics Similar to Colombians by Male Unemployment
In terms of male unemployment, the demographic groups most similar to Colombians are Pakistani (5.2%, a difference of 0.060%), Immigrants from Saudi Arabia (5.2%, a difference of 0.090%), Lebanese (5.2%, a difference of 0.11%), Immigrants from Eastern Africa (5.2%, a difference of 0.12%), and Immigrants from Croatia (5.2%, a difference of 0.13%).
| Demographics | Rating | Rank | Male Unemployment |
| Immigrants | Colombia | 86.8 /100 | #126 | Excellent 5.1% |
| Immigrants | Brazil | 86.3 /100 | #127 | Excellent 5.2% |
| Hungarians | 85.1 /100 | #128 | Excellent 5.2% |
| Immigrants | Western Europe | 84.8 /100 | #129 | Excellent 5.2% |
| Immigrants | Malaysia | 83.5 /100 | #130 | Excellent 5.2% |
| Immigrants | Germany | 83.0 /100 | #131 | Excellent 5.2% |
| Chickasaw | 82.9 /100 | #132 | Excellent 5.2% |
| Colombians | 81.1 /100 | #133 | Excellent 5.2% |
| Pakistanis | 80.5 /100 | #134 | Excellent 5.2% |
| Immigrants | Saudi Arabia | 80.1 /100 | #135 | Excellent 5.2% |
| Lebanese | 79.9 /100 | #136 | Good 5.2% |
| Immigrants | Eastern Africa | 79.8 /100 | #137 | Good 5.2% |
| Immigrants | Croatia | 79.7 /100 | #138 | Good 5.2% |
| Kenyans | 79.4 /100 | #139 | Good 5.2% |
| Brazilians | 79.3 /100 | #140 | Good 5.2% |