Immigrants from Belize vs Luxembourger Unemployment Among Women with Children Ages 6 to 17 years
COMPARE
Immigrants from Belize
Luxembourger
Unemployment Among Women with Children Ages 6 to 17 years
Unemployment Among Women with Children Ages 6 to 17 years Comparison
Immigrants from Belize
Luxembourgers
9.3%
UNEMPLOYMENT AMONG WOMEN WITH CHILDREN AGES 6 TO 17 YEARS
2.8/ 100
METRIC RATING
237th/ 347
METRIC RANK
8.3%
UNEMPLOYMENT AMONG WOMEN WITH CHILDREN AGES 6 TO 17 YEARS
99.9/ 100
METRIC RATING
66th/ 347
METRIC RANK
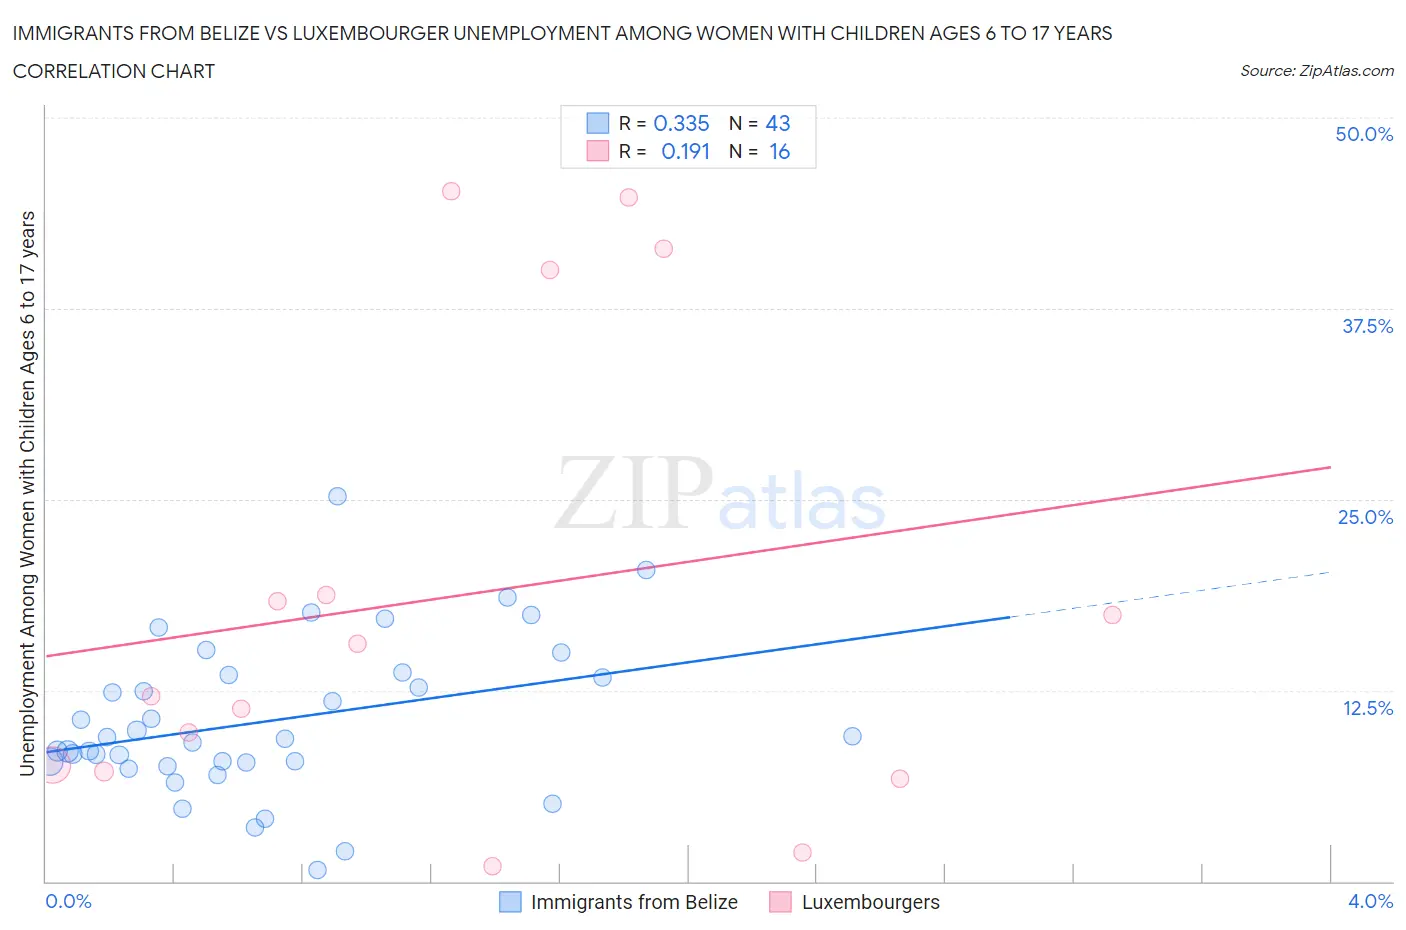
Immigrants from Belize vs Luxembourger Unemployment Among Women with Children Ages 6 to 17 years Correlation Chart
The statistical analysis conducted on geographies consisting of 113,544,654 people shows a mild positive correlation between the proportion of Immigrants from Belize and unemployment rate among women with children between the ages 6 and 17 in the United States with a correlation coefficient (R) of 0.335 and weighted average of 9.3%. Similarly, the statistical analysis conducted on geographies consisting of 115,314,125 people shows a poor positive correlation between the proportion of Luxembourgers and unemployment rate among women with children between the ages 6 and 17 in the United States with a correlation coefficient (R) of 0.191 and weighted average of 8.3%, a difference of 12.4%.
Unemployment Among Women with Children Ages 6 to 17 years Correlation Summary
| Measurement | Immigrants from Belize | Luxembourger |
| Minimum | 0.70% | 0.97% |
| Maximum | 25.2% | 45.2% |
| Range | 24.5% | 44.2% |
| Mean | 10.5% | 18.7% |
| Median | 9.3% | 13.9% |
| Interquartile 25% (IQ1) | 7.8% | 7.4% |
| Interquartile 75% (IQ3) | 13.5% | 29.4% |
| Interquartile Range (IQR) | 5.7% | 21.9% |
| Standard Deviation (Sample) | 5.1% | 15.4% |
| Standard Deviation (Population) | 5.0% | 14.9% |
Similar Demographics by Unemployment Among Women with Children Ages 6 to 17 years
Demographics Similar to Immigrants from Belize by Unemployment Among Women with Children Ages 6 to 17 years
In terms of unemployment among women with children ages 6 to 17 years, the demographic groups most similar to Immigrants from Belize are Hungarian (9.3%, a difference of 0.050%), Uruguayan (9.3%, a difference of 0.070%), Arab (9.3%, a difference of 0.080%), Immigrants from Saudi Arabia (9.3%, a difference of 0.080%), and Mexican (9.3%, a difference of 0.14%).
| Demographics | Rating | Rank | Unemployment Among Women with Children Ages 6 to 17 years |
| Welsh | 4.0 /100 | #230 | Tragic 9.3% |
| Macedonians | 3.9 /100 | #231 | Tragic 9.3% |
| French American Indians | 3.7 /100 | #232 | Tragic 9.3% |
| Immigrants | St. Vincent and the Grenadines | 3.3 /100 | #233 | Tragic 9.3% |
| Mexicans | 3.2 /100 | #234 | Tragic 9.3% |
| Uruguayans | 3.0 /100 | #235 | Tragic 9.3% |
| Hungarians | 3.0 /100 | #236 | Tragic 9.3% |
| Immigrants | Belize | 2.8 /100 | #237 | Tragic 9.3% |
| Arabs | 2.7 /100 | #238 | Tragic 9.3% |
| Immigrants | Saudi Arabia | 2.7 /100 | #239 | Tragic 9.3% |
| Guatemalans | 2.3 /100 | #240 | Tragic 9.3% |
| Colombians | 2.2 /100 | #241 | Tragic 9.3% |
| Immigrants | Colombia | 2.1 /100 | #242 | Tragic 9.3% |
| Scottish | 2.0 /100 | #243 | Tragic 9.4% |
| English | 1.9 /100 | #244 | Tragic 9.4% |
Demographics Similar to Luxembourgers by Unemployment Among Women with Children Ages 6 to 17 years
In terms of unemployment among women with children ages 6 to 17 years, the demographic groups most similar to Luxembourgers are Armenian (8.3%, a difference of 0.10%), Immigrants from Albania (8.3%, a difference of 0.13%), Marshallese (8.3%, a difference of 0.18%), Immigrants from Thailand (8.3%, a difference of 0.21%), and Immigrants from Kuwait (8.3%, a difference of 0.22%).
| Demographics | Rating | Rank | Unemployment Among Women with Children Ages 6 to 17 years |
| Immigrants | Philippines | 100.0 /100 | #59 | Exceptional 8.2% |
| Basques | 100.0 /100 | #60 | Exceptional 8.2% |
| Koreans | 100.0 /100 | #61 | Exceptional 8.2% |
| Spanish American Indians | 100.0 /100 | #62 | Exceptional 8.2% |
| Immigrants | South Eastern Asia | 99.9 /100 | #63 | Exceptional 8.2% |
| Immigrants | Kuwait | 99.9 /100 | #64 | Exceptional 8.3% |
| Immigrants | Albania | 99.9 /100 | #65 | Exceptional 8.3% |
| Luxembourgers | 99.9 /100 | #66 | Exceptional 8.3% |
| Armenians | 99.9 /100 | #67 | Exceptional 8.3% |
| Marshallese | 99.9 /100 | #68 | Exceptional 8.3% |
| Immigrants | Thailand | 99.9 /100 | #69 | Exceptional 8.3% |
| Norwegians | 99.9 /100 | #70 | Exceptional 8.3% |
| Immigrants | Australia | 99.8 /100 | #71 | Exceptional 8.3% |
| Immigrants | Nepal | 99.8 /100 | #72 | Exceptional 8.3% |
| Spanish Americans | 99.8 /100 | #73 | Exceptional 8.4% |