Immigrants from Belize vs Alaskan Athabascan Unemployment Among Women with Children Ages 6 to 17 years
COMPARE
Immigrants from Belize
Alaskan Athabascan
Unemployment Among Women with Children Ages 6 to 17 years
Unemployment Among Women with Children Ages 6 to 17 years Comparison
Immigrants from Belize
Alaskan Athabascans
9.3%
UNEMPLOYMENT AMONG WOMEN WITH CHILDREN AGES 6 TO 17 YEARS
2.8/ 100
METRIC RATING
237th/ 347
METRIC RANK
8.5%
UNEMPLOYMENT AMONG WOMEN WITH CHILDREN AGES 6 TO 17 YEARS
99.4/ 100
METRIC RATING
86th/ 347
METRIC RANK
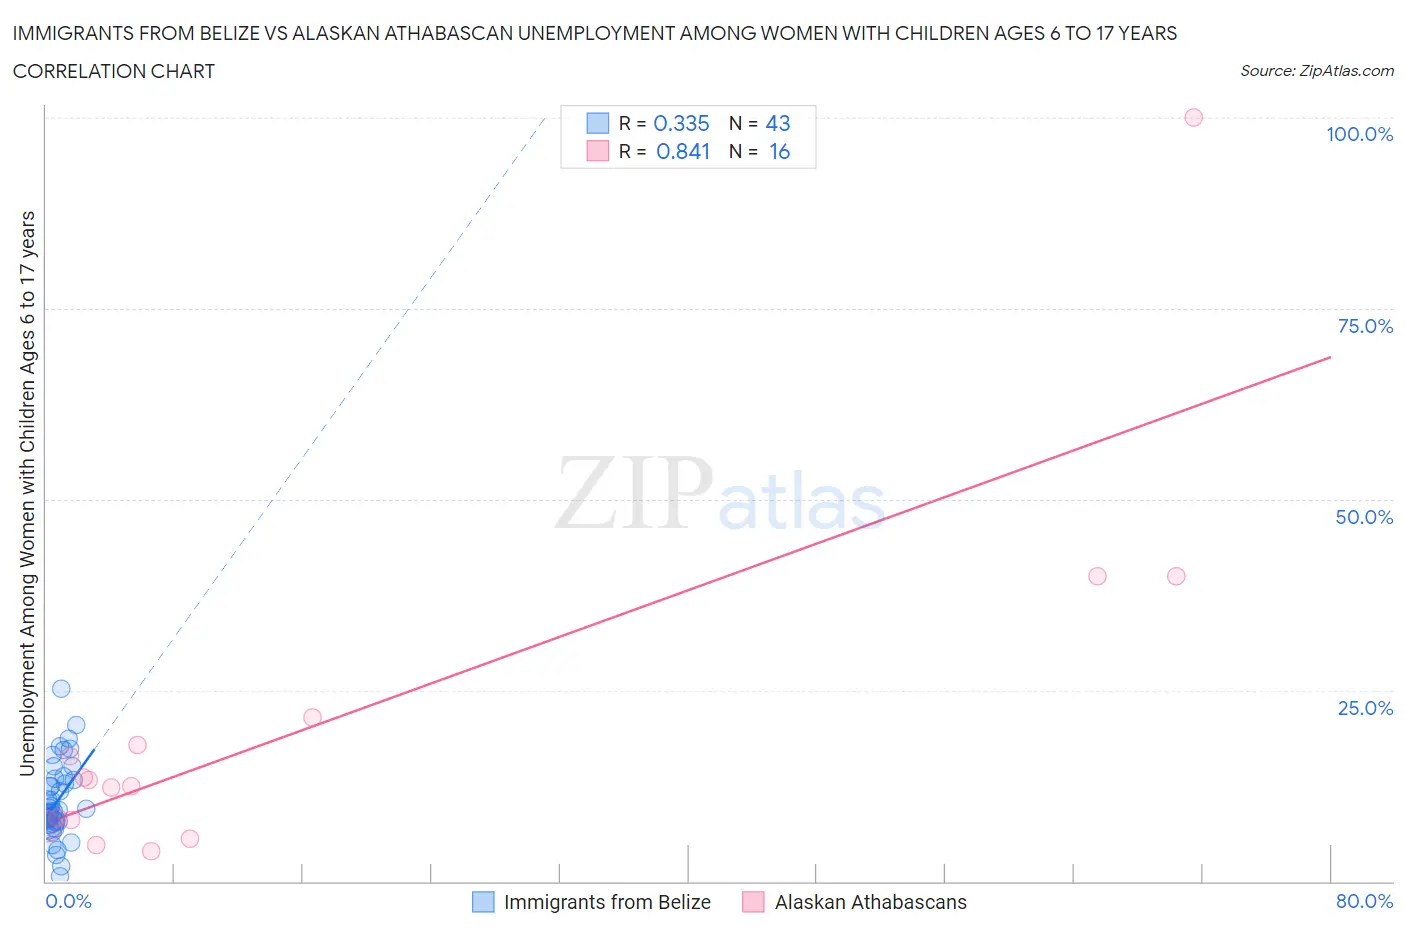
Immigrants from Belize vs Alaskan Athabascan Unemployment Among Women with Children Ages 6 to 17 years Correlation Chart
The statistical analysis conducted on geographies consisting of 113,544,654 people shows a mild positive correlation between the proportion of Immigrants from Belize and unemployment rate among women with children between the ages 6 and 17 in the United States with a correlation coefficient (R) of 0.335 and weighted average of 9.3%. Similarly, the statistical analysis conducted on geographies consisting of 40,653,109 people shows a very strong positive correlation between the proportion of Alaskan Athabascans and unemployment rate among women with children between the ages 6 and 17 in the United States with a correlation coefficient (R) of 0.841 and weighted average of 8.5%, a difference of 10.1%.
Unemployment Among Women with Children Ages 6 to 17 years Correlation Summary
| Measurement | Immigrants from Belize | Alaskan Athabascan |
| Minimum | 0.70% | 3.9% |
| Maximum | 25.2% | 100.0% |
| Range | 24.5% | 96.1% |
| Mean | 10.5% | 20.3% |
| Median | 9.3% | 12.9% |
| Interquartile 25% (IQ1) | 7.8% | 7.6% |
| Interquartile 75% (IQ3) | 13.5% | 19.6% |
| Interquartile Range (IQR) | 5.7% | 12.0% |
| Standard Deviation (Sample) | 5.1% | 23.9% |
| Standard Deviation (Population) | 5.0% | 23.1% |
Similar Demographics by Unemployment Among Women with Children Ages 6 to 17 years
Demographics Similar to Immigrants from Belize by Unemployment Among Women with Children Ages 6 to 17 years
In terms of unemployment among women with children ages 6 to 17 years, the demographic groups most similar to Immigrants from Belize are Hungarian (9.3%, a difference of 0.050%), Uruguayan (9.3%, a difference of 0.070%), Arab (9.3%, a difference of 0.080%), Immigrants from Saudi Arabia (9.3%, a difference of 0.080%), and Mexican (9.3%, a difference of 0.14%).
| Demographics | Rating | Rank | Unemployment Among Women with Children Ages 6 to 17 years |
| Welsh | 4.0 /100 | #230 | Tragic 9.3% |
| Macedonians | 3.9 /100 | #231 | Tragic 9.3% |
| French American Indians | 3.7 /100 | #232 | Tragic 9.3% |
| Immigrants | St. Vincent and the Grenadines | 3.3 /100 | #233 | Tragic 9.3% |
| Mexicans | 3.2 /100 | #234 | Tragic 9.3% |
| Uruguayans | 3.0 /100 | #235 | Tragic 9.3% |
| Hungarians | 3.0 /100 | #236 | Tragic 9.3% |
| Immigrants | Belize | 2.8 /100 | #237 | Tragic 9.3% |
| Arabs | 2.7 /100 | #238 | Tragic 9.3% |
| Immigrants | Saudi Arabia | 2.7 /100 | #239 | Tragic 9.3% |
| Guatemalans | 2.3 /100 | #240 | Tragic 9.3% |
| Colombians | 2.2 /100 | #241 | Tragic 9.3% |
| Immigrants | Colombia | 2.1 /100 | #242 | Tragic 9.3% |
| Scottish | 2.0 /100 | #243 | Tragic 9.4% |
| English | 1.9 /100 | #244 | Tragic 9.4% |
Demographics Similar to Alaskan Athabascans by Unemployment Among Women with Children Ages 6 to 17 years
In terms of unemployment among women with children ages 6 to 17 years, the demographic groups most similar to Alaskan Athabascans are Immigrants from North Macedonia (8.5%, a difference of 0.15%), Japanese (8.4%, a difference of 0.19%), Bulgarian (8.4%, a difference of 0.30%), Immigrants from Israel (8.5%, a difference of 0.33%), and Immigrants from Vietnam (8.5%, a difference of 0.35%).
| Demographics | Rating | Rank | Unemployment Among Women with Children Ages 6 to 17 years |
| Mongolians | 99.6 /100 | #79 | Exceptional 8.4% |
| Immigrants | Belarus | 99.6 /100 | #80 | Exceptional 8.4% |
| Immigrants | Bolivia | 99.6 /100 | #81 | Exceptional 8.4% |
| Cypriots | 99.6 /100 | #82 | Exceptional 8.4% |
| Bulgarians | 99.5 /100 | #83 | Exceptional 8.4% |
| Japanese | 99.5 /100 | #84 | Exceptional 8.4% |
| Immigrants | North Macedonia | 99.4 /100 | #85 | Exceptional 8.5% |
| Alaskan Athabascans | 99.4 /100 | #86 | Exceptional 8.5% |
| Immigrants | Israel | 99.1 /100 | #87 | Exceptional 8.5% |
| Immigrants | Vietnam | 99.1 /100 | #88 | Exceptional 8.5% |
| Paiute | 99.1 /100 | #89 | Exceptional 8.5% |
| Yugoslavians | 99.0 /100 | #90 | Exceptional 8.5% |
| Immigrants | Eastern Europe | 99.0 /100 | #91 | Exceptional 8.5% |
| Potawatomi | 99.0 /100 | #92 | Exceptional 8.5% |
| Australians | 98.9 /100 | #93 | Exceptional 8.5% |