Immigrants from Ireland vs Alaskan Athabascan Unemployment Among Women with Children Ages 6 to 17 years
COMPARE
Immigrants from Ireland
Alaskan Athabascan
Unemployment Among Women with Children Ages 6 to 17 years
Unemployment Among Women with Children Ages 6 to 17 years Comparison
Immigrants from Ireland
Alaskan Athabascans
8.7%
UNEMPLOYMENT AMONG WOMEN WITH CHILDREN AGES 6 TO 17 YEARS
91.0/ 100
METRIC RATING
134th/ 347
METRIC RANK
8.5%
UNEMPLOYMENT AMONG WOMEN WITH CHILDREN AGES 6 TO 17 YEARS
99.4/ 100
METRIC RATING
86th/ 347
METRIC RANK
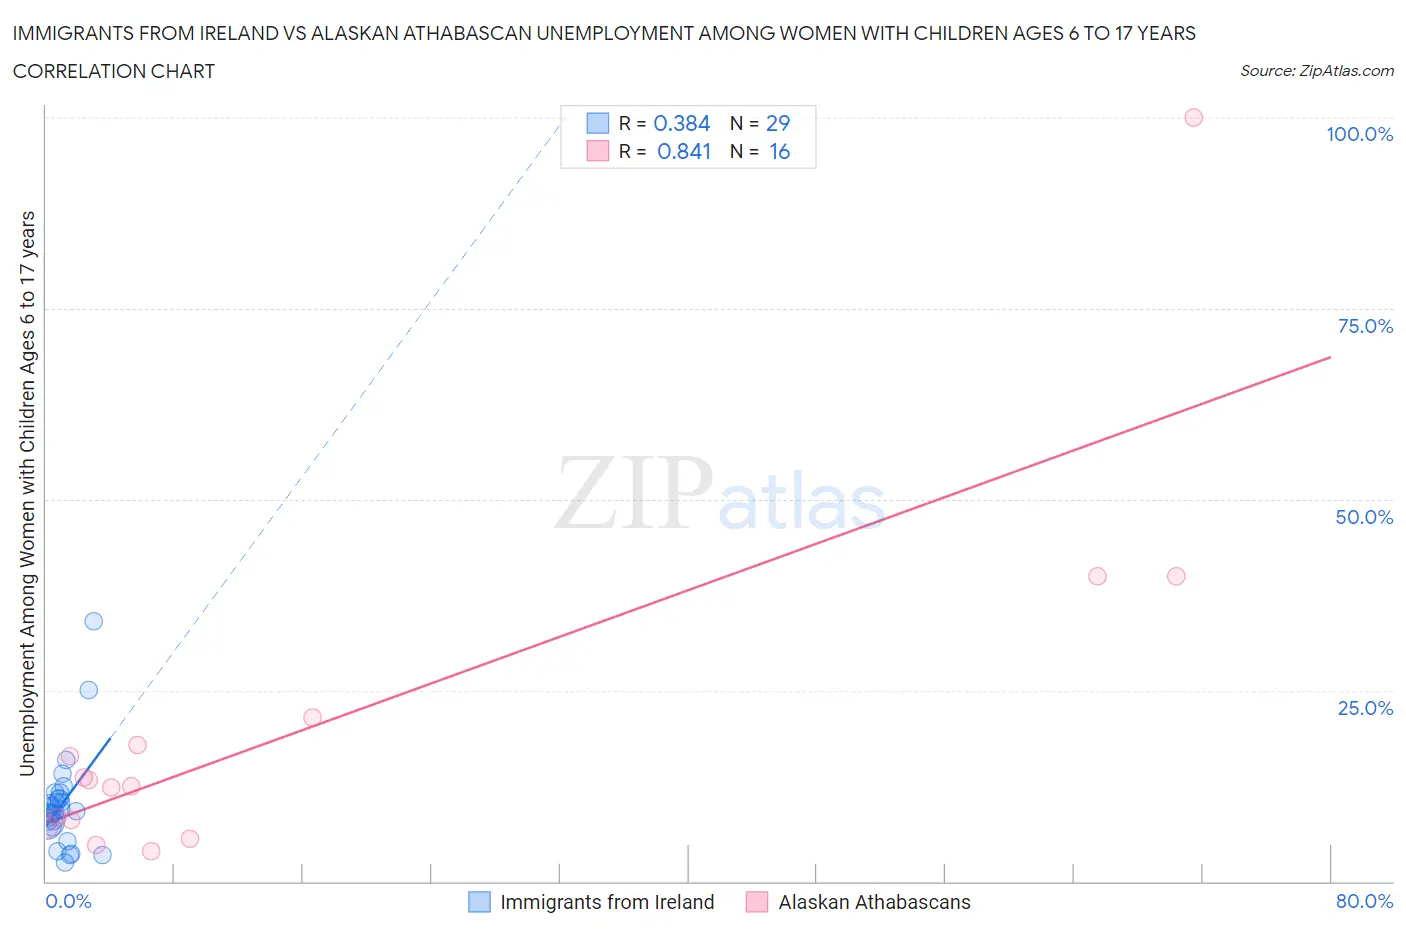
Immigrants from Ireland vs Alaskan Athabascan Unemployment Among Women with Children Ages 6 to 17 years Correlation Chart
The statistical analysis conducted on geographies consisting of 183,056,038 people shows a mild positive correlation between the proportion of Immigrants from Ireland and unemployment rate among women with children between the ages 6 and 17 in the United States with a correlation coefficient (R) of 0.384 and weighted average of 8.7%. Similarly, the statistical analysis conducted on geographies consisting of 40,653,109 people shows a very strong positive correlation between the proportion of Alaskan Athabascans and unemployment rate among women with children between the ages 6 and 17 in the United States with a correlation coefficient (R) of 0.841 and weighted average of 8.5%, a difference of 3.2%.
Unemployment Among Women with Children Ages 6 to 17 years Correlation Summary
| Measurement | Immigrants from Ireland | Alaskan Athabascan |
| Minimum | 2.4% | 3.9% |
| Maximum | 34.1% | 100.0% |
| Range | 31.7% | 96.1% |
| Mean | 10.1% | 20.3% |
| Median | 9.1% | 12.9% |
| Interquartile 25% (IQ1) | 7.5% | 7.6% |
| Interquartile 75% (IQ3) | 11.2% | 19.6% |
| Interquartile Range (IQR) | 3.7% | 12.0% |
| Standard Deviation (Sample) | 6.4% | 23.9% |
| Standard Deviation (Population) | 6.3% | 23.1% |
Similar Demographics by Unemployment Among Women with Children Ages 6 to 17 years
Demographics Similar to Immigrants from Ireland by Unemployment Among Women with Children Ages 6 to 17 years
In terms of unemployment among women with children ages 6 to 17 years, the demographic groups most similar to Immigrants from Ireland are European (8.7%, a difference of 0.060%), Immigrants from Latvia (8.7%, a difference of 0.090%), Egyptian (8.7%, a difference of 0.11%), Immigrants from Argentina (8.7%, a difference of 0.14%), and Yaqui (8.7%, a difference of 0.17%).
| Demographics | Rating | Rank | Unemployment Among Women with Children Ages 6 to 17 years |
| Czechs | 94.4 /100 | #127 | Exceptional 8.7% |
| Hmong | 94.3 /100 | #128 | Exceptional 8.7% |
| Barbadians | 93.8 /100 | #129 | Exceptional 8.7% |
| Immigrants | Western Asia | 93.1 /100 | #130 | Exceptional 8.7% |
| Slavs | 92.2 /100 | #131 | Exceptional 8.7% |
| Yaqui | 92.2 /100 | #132 | Exceptional 8.7% |
| Egyptians | 91.8 /100 | #133 | Exceptional 8.7% |
| Immigrants | Ireland | 91.0 /100 | #134 | Exceptional 8.7% |
| Europeans | 90.6 /100 | #135 | Exceptional 8.7% |
| Immigrants | Latvia | 90.4 /100 | #136 | Exceptional 8.7% |
| Immigrants | Argentina | 90.0 /100 | #137 | Excellent 8.7% |
| Immigrants | Ethiopia | 89.5 /100 | #138 | Excellent 8.8% |
| Northern Europeans | 89.2 /100 | #139 | Excellent 8.8% |
| Immigrants | Poland | 88.3 /100 | #140 | Excellent 8.8% |
| Serbians | 87.6 /100 | #141 | Excellent 8.8% |
Demographics Similar to Alaskan Athabascans by Unemployment Among Women with Children Ages 6 to 17 years
In terms of unemployment among women with children ages 6 to 17 years, the demographic groups most similar to Alaskan Athabascans are Immigrants from North Macedonia (8.5%, a difference of 0.15%), Japanese (8.4%, a difference of 0.19%), Bulgarian (8.4%, a difference of 0.30%), Immigrants from Israel (8.5%, a difference of 0.33%), and Immigrants from Vietnam (8.5%, a difference of 0.35%).
| Demographics | Rating | Rank | Unemployment Among Women with Children Ages 6 to 17 years |
| Mongolians | 99.6 /100 | #79 | Exceptional 8.4% |
| Immigrants | Belarus | 99.6 /100 | #80 | Exceptional 8.4% |
| Immigrants | Bolivia | 99.6 /100 | #81 | Exceptional 8.4% |
| Cypriots | 99.6 /100 | #82 | Exceptional 8.4% |
| Bulgarians | 99.5 /100 | #83 | Exceptional 8.4% |
| Japanese | 99.5 /100 | #84 | Exceptional 8.4% |
| Immigrants | North Macedonia | 99.4 /100 | #85 | Exceptional 8.5% |
| Alaskan Athabascans | 99.4 /100 | #86 | Exceptional 8.5% |
| Immigrants | Israel | 99.1 /100 | #87 | Exceptional 8.5% |
| Immigrants | Vietnam | 99.1 /100 | #88 | Exceptional 8.5% |
| Paiute | 99.1 /100 | #89 | Exceptional 8.5% |
| Yugoslavians | 99.0 /100 | #90 | Exceptional 8.5% |
| Immigrants | Eastern Europe | 99.0 /100 | #91 | Exceptional 8.5% |
| Potawatomi | 99.0 /100 | #92 | Exceptional 8.5% |
| Australians | 98.9 /100 | #93 | Exceptional 8.5% |