Dominican vs Immigrants from Korea Male Unemployment
COMPARE
Dominican
Immigrants from Korea
Male Unemployment
Male Unemployment Comparison
Dominicans
Immigrants from Korea
7.6%
MALE UNEMPLOYMENT
0.0/ 100
METRIC RATING
324th/ 347
METRIC RANK
4.9%
MALE UNEMPLOYMENT
99.1/ 100
METRIC RATING
44th/ 347
METRIC RANK
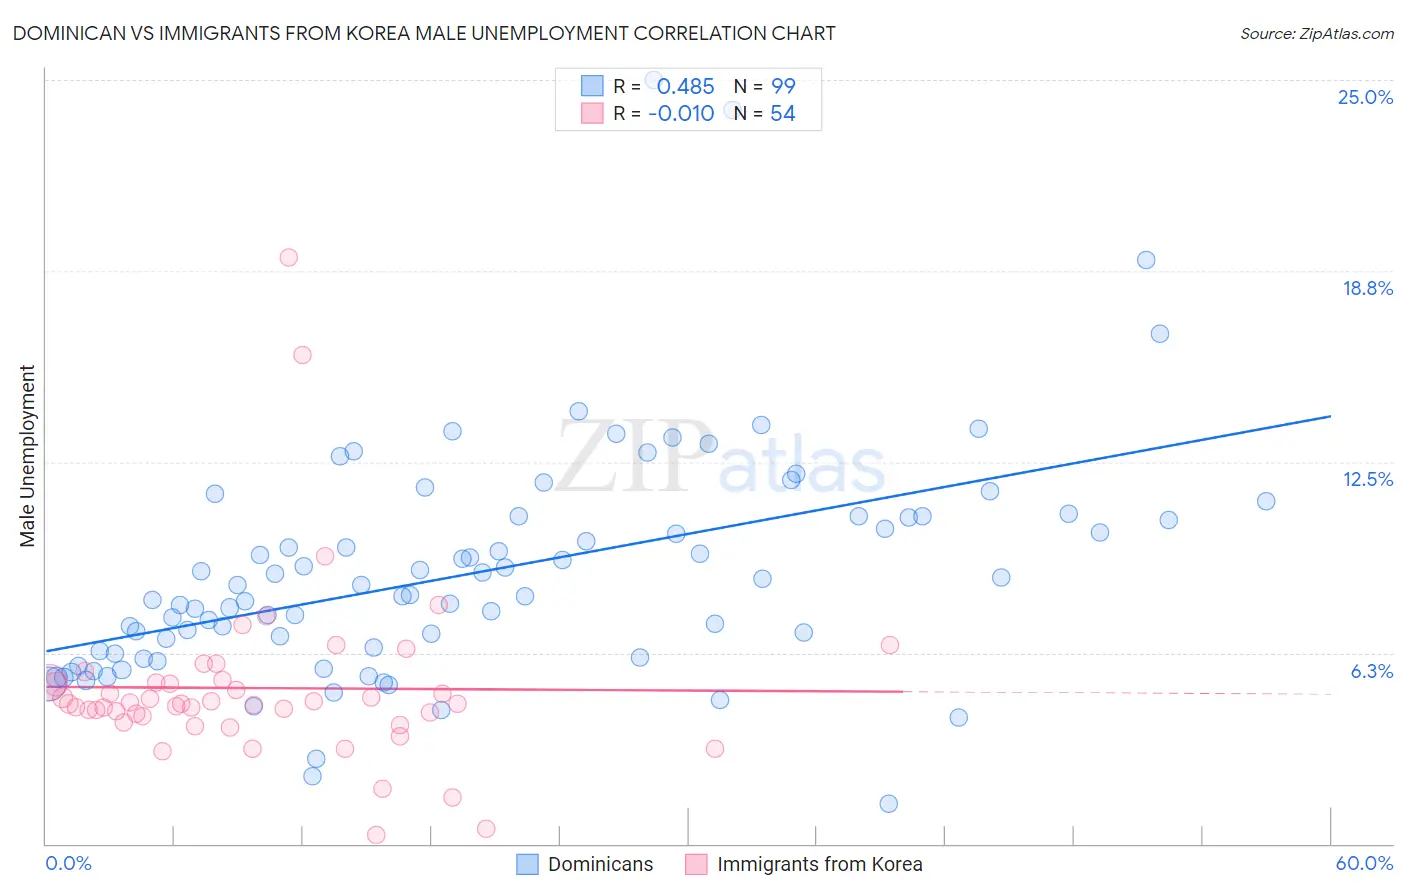
Dominican vs Immigrants from Korea Male Unemployment Correlation Chart
The statistical analysis conducted on geographies consisting of 353,678,027 people shows a moderate positive correlation between the proportion of Dominicans and unemployment rate among males in the United States with a correlation coefficient (R) of 0.485 and weighted average of 7.6%. Similarly, the statistical analysis conducted on geographies consisting of 414,464,791 people shows no correlation between the proportion of Immigrants from Korea and unemployment rate among males in the United States with a correlation coefficient (R) of -0.010 and weighted average of 4.9%, a difference of 53.5%.
Male Unemployment Correlation Summary
| Measurement | Dominican | Immigrants from Korea |
| Minimum | 1.3% | 0.30% |
| Maximum | 25.0% | 19.2% |
| Range | 23.7% | 18.9% |
| Mean | 8.9% | 5.1% |
| Median | 8.1% | 4.6% |
| Interquartile 25% (IQ1) | 6.2% | 4.2% |
| Interquartile 75% (IQ3) | 10.7% | 5.3% |
| Interquartile Range (IQR) | 4.5% | 1.1% |
| Standard Deviation (Sample) | 3.8% | 3.0% |
| Standard Deviation (Population) | 3.8% | 2.9% |
Similar Demographics by Male Unemployment
Demographics Similar to Dominicans by Male Unemployment
In terms of male unemployment, the demographic groups most similar to Dominicans are Immigrants from Grenada (7.6%, a difference of 0.27%), Shoshone (7.6%, a difference of 0.37%), Immigrants from Dominican Republic (7.6%, a difference of 0.48%), Immigrants from Cabo Verde (7.5%, a difference of 1.1%), and Immigrants from St. Vincent and the Grenadines (7.5%, a difference of 1.4%).
| Demographics | Rating | Rank | Male Unemployment |
| Guyanese | 0.0 /100 | #317 | Tragic 7.1% |
| Cape Verdeans | 0.0 /100 | #318 | Tragic 7.1% |
| British West Indians | 0.0 /100 | #319 | Tragic 7.3% |
| Colville | 0.0 /100 | #320 | Tragic 7.4% |
| Immigrants | St. Vincent and the Grenadines | 0.0 /100 | #321 | Tragic 7.5% |
| Immigrants | Cabo Verde | 0.0 /100 | #322 | Tragic 7.5% |
| Immigrants | Grenada | 0.0 /100 | #323 | Tragic 7.6% |
| Dominicans | 0.0 /100 | #324 | Tragic 7.6% |
| Shoshone | 0.0 /100 | #325 | Tragic 7.6% |
| Immigrants | Dominican Republic | 0.0 /100 | #326 | Tragic 7.6% |
| Paiute | 0.0 /100 | #327 | Tragic 7.7% |
| Natives/Alaskans | 0.0 /100 | #328 | Tragic 7.7% |
| Immigrants | Yemen | 0.0 /100 | #329 | Tragic 7.8% |
| Yakama | 0.0 /100 | #330 | Tragic 7.9% |
| Alaska Natives | 0.0 /100 | #331 | Tragic 8.1% |
Demographics Similar to Immigrants from Korea by Male Unemployment
In terms of male unemployment, the demographic groups most similar to Immigrants from Korea are Immigrants from Zimbabwe (4.9%, a difference of 0.15%), Immigrants from Japan (4.9%, a difference of 0.18%), Bhutanese (4.9%, a difference of 0.24%), Immigrants from Belgium (4.9%, a difference of 0.29%), and Chinese (4.9%, a difference of 0.31%).
| Demographics | Rating | Rank | Male Unemployment |
| Scotch-Irish | 99.4 /100 | #37 | Exceptional 4.9% |
| Immigrants | Bosnia and Herzegovina | 99.4 /100 | #38 | Exceptional 4.9% |
| Burmese | 99.3 /100 | #39 | Exceptional 4.9% |
| Northern Europeans | 99.3 /100 | #40 | Exceptional 4.9% |
| Chinese | 99.3 /100 | #41 | Exceptional 4.9% |
| Immigrants | Belgium | 99.2 /100 | #42 | Exceptional 4.9% |
| Immigrants | Japan | 99.2 /100 | #43 | Exceptional 4.9% |
| Immigrants | Korea | 99.1 /100 | #44 | Exceptional 4.9% |
| Immigrants | Zimbabwe | 99.0 /100 | #45 | Exceptional 4.9% |
| Bhutanese | 98.9 /100 | #46 | Exceptional 4.9% |
| Austrians | 98.9 /100 | #47 | Exceptional 4.9% |
| Immigrants | Scotland | 98.9 /100 | #48 | Exceptional 4.9% |
| Poles | 98.9 /100 | #49 | Exceptional 4.9% |
| Croatians | 98.9 /100 | #50 | Exceptional 4.9% |
| Slovenes | 98.8 /100 | #51 | Exceptional 5.0% |