Dominican vs Colombian Male Unemployment
COMPARE
Dominican
Colombian
Male Unemployment
Male Unemployment Comparison
Dominicans
Colombians
7.6%
MALE UNEMPLOYMENT
0.0/ 100
METRIC RATING
324th/ 347
METRIC RANK
5.2%
MALE UNEMPLOYMENT
81.1/ 100
METRIC RATING
133rd/ 347
METRIC RANK
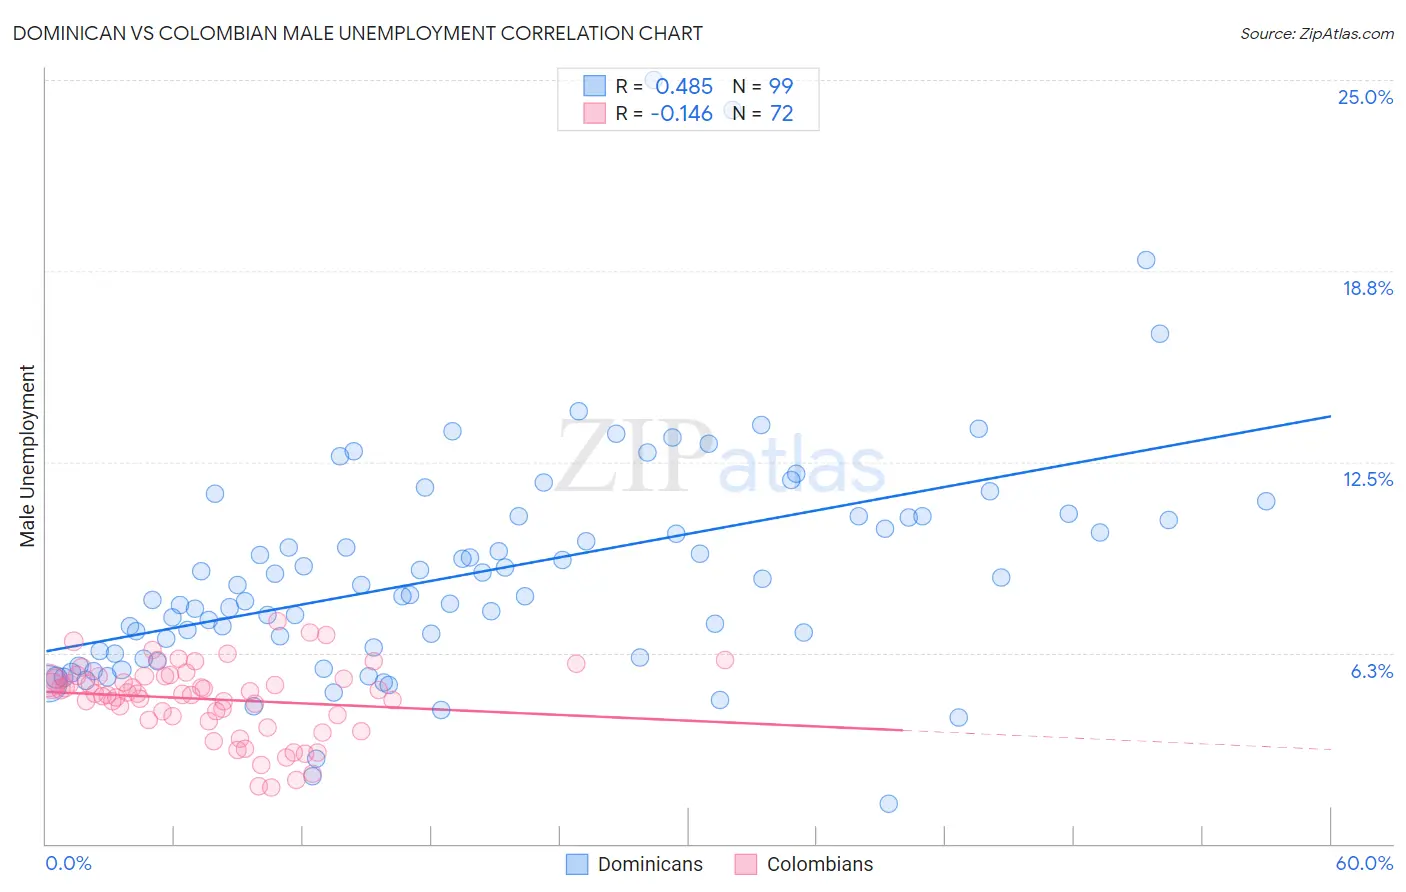
Dominican vs Colombian Male Unemployment Correlation Chart
The statistical analysis conducted on geographies consisting of 353,678,027 people shows a moderate positive correlation between the proportion of Dominicans and unemployment rate among males in the United States with a correlation coefficient (R) of 0.485 and weighted average of 7.6%. Similarly, the statistical analysis conducted on geographies consisting of 417,848,253 people shows a poor negative correlation between the proportion of Colombians and unemployment rate among males in the United States with a correlation coefficient (R) of -0.146 and weighted average of 5.2%, a difference of 46.1%.
Male Unemployment Correlation Summary
| Measurement | Dominican | Colombian |
| Minimum | 1.3% | 1.8% |
| Maximum | 25.0% | 7.3% |
| Range | 23.7% | 5.4% |
| Mean | 8.9% | 4.7% |
| Median | 8.1% | 4.9% |
| Interquartile 25% (IQ1) | 6.2% | 4.1% |
| Interquartile 75% (IQ3) | 10.7% | 5.5% |
| Interquartile Range (IQR) | 4.5% | 1.4% |
| Standard Deviation (Sample) | 3.8% | 1.2% |
| Standard Deviation (Population) | 3.8% | 1.2% |
Similar Demographics by Male Unemployment
Demographics Similar to Dominicans by Male Unemployment
In terms of male unemployment, the demographic groups most similar to Dominicans are Immigrants from Grenada (7.6%, a difference of 0.27%), Shoshone (7.6%, a difference of 0.37%), Immigrants from Dominican Republic (7.6%, a difference of 0.48%), Immigrants from Cabo Verde (7.5%, a difference of 1.1%), and Immigrants from St. Vincent and the Grenadines (7.5%, a difference of 1.4%).
| Demographics | Rating | Rank | Male Unemployment |
| Guyanese | 0.0 /100 | #317 | Tragic 7.1% |
| Cape Verdeans | 0.0 /100 | #318 | Tragic 7.1% |
| British West Indians | 0.0 /100 | #319 | Tragic 7.3% |
| Colville | 0.0 /100 | #320 | Tragic 7.4% |
| Immigrants | St. Vincent and the Grenadines | 0.0 /100 | #321 | Tragic 7.5% |
| Immigrants | Cabo Verde | 0.0 /100 | #322 | Tragic 7.5% |
| Immigrants | Grenada | 0.0 /100 | #323 | Tragic 7.6% |
| Dominicans | 0.0 /100 | #324 | Tragic 7.6% |
| Shoshone | 0.0 /100 | #325 | Tragic 7.6% |
| Immigrants | Dominican Republic | 0.0 /100 | #326 | Tragic 7.6% |
| Paiute | 0.0 /100 | #327 | Tragic 7.7% |
| Natives/Alaskans | 0.0 /100 | #328 | Tragic 7.7% |
| Immigrants | Yemen | 0.0 /100 | #329 | Tragic 7.8% |
| Yakama | 0.0 /100 | #330 | Tragic 7.9% |
| Alaska Natives | 0.0 /100 | #331 | Tragic 8.1% |
Demographics Similar to Colombians by Male Unemployment
In terms of male unemployment, the demographic groups most similar to Colombians are Pakistani (5.2%, a difference of 0.060%), Immigrants from Saudi Arabia (5.2%, a difference of 0.090%), Lebanese (5.2%, a difference of 0.11%), Immigrants from Eastern Africa (5.2%, a difference of 0.12%), and Immigrants from Croatia (5.2%, a difference of 0.13%).
| Demographics | Rating | Rank | Male Unemployment |
| Immigrants | Colombia | 86.8 /100 | #126 | Excellent 5.1% |
| Immigrants | Brazil | 86.3 /100 | #127 | Excellent 5.2% |
| Hungarians | 85.1 /100 | #128 | Excellent 5.2% |
| Immigrants | Western Europe | 84.8 /100 | #129 | Excellent 5.2% |
| Immigrants | Malaysia | 83.5 /100 | #130 | Excellent 5.2% |
| Immigrants | Germany | 83.0 /100 | #131 | Excellent 5.2% |
| Chickasaw | 82.9 /100 | #132 | Excellent 5.2% |
| Colombians | 81.1 /100 | #133 | Excellent 5.2% |
| Pakistanis | 80.5 /100 | #134 | Excellent 5.2% |
| Immigrants | Saudi Arabia | 80.1 /100 | #135 | Excellent 5.2% |
| Lebanese | 79.9 /100 | #136 | Good 5.2% |
| Immigrants | Eastern Africa | 79.8 /100 | #137 | Good 5.2% |
| Immigrants | Croatia | 79.7 /100 | #138 | Good 5.2% |
| Kenyans | 79.4 /100 | #139 | Good 5.2% |
| Brazilians | 79.3 /100 | #140 | Good 5.2% |