Lebanese vs Immigrants from Caribbean Male Unemployment

COMPARE

Lebanese
Race
Ancestry
AfghanAfricanAlaska NativeAlaskan AthabascanAlbanianAleutAlsatianAmericanApacheArabArapahoArgentineanArmenianAssyrian/Chaldean/SyriacAustralianAustrianBahamianBangladeshiBarbadianBasqueBelgianBelizeanBermudanBhutaneseBlackfeetBolivianBrazilianBritishBritish West IndianBulgarianBurmeseCajunCambodianCanadianCape VerdeanCarpatho RusynCelticCentral AmericanCentral American IndianCherokeeCheyenneChickasawChileanChineseChippewaChoctawColombianColvilleComancheCosta RicanCreeCreekCroatianCrowCubanCypriotCzechCzechoslovakianDanishDelawareDominicanDutchDutch West IndianEastern EuropeanEcuadorianEgyptianEnglishEstonianEthiopianEuropeanFijianFilipinoFinnishFrenchFrench American IndianFrench CanadianGermanGerman RussianGhanaianGreekGuamanian/ChamorroGuatemalanGuyaneseHaitianHmongHonduranHopiHoumaHungarianIcelanderIndian (Asian)IndonesianInupiatIranianIraqiIrishIroquoisIsraeliItalianJamaicanJapaneseJordanianKenyanKiowaKoreanLaotianLatvianLebaneseLiberianLithuanianLumbeeLuxembourgerMacedonianMalaysianMalteseMarshalleseMenomineeMexicanMexican American IndianMongolianMoroccanNative HawaiianNavajoNepaleseNew ZealanderNicaraguanNigerianNorthern EuropeanNorwegianOkinawanOsageOttawaPaiutePakistaniPalestinianPanamanianParaguayanPennsylvania GermanPeruvianPimaPolishPortuguesePotawatomiPuebloPuerto RicanPuget Sound SalishRomanianRussianSalvadoranSamoanScandinavianScotch-IrishScottishSeminoleSenegaleseSerbianShoshoneSierra LeoneanSiouxSlavicSlovakSloveneSomaliSouth AfricanSouth AmericanSouth American IndianSoviet UnionSpaniardSpanishSpanish AmericanSpanish American IndianSri LankanSubsaharan AfricanSudaneseSwedishSwissSyrianTaiwaneseThaiTlingit-HaidaTohono O'OdhamTonganTrinidadian and TobagonianTsimshianTurkishU.S. Virgin IslanderUgandanUkrainianUruguayanUteVenezuelanVietnameseWelshWest IndianYakamaYaquiYugoslavianYumanYup'ikZimbabwean
Immigration
NonimmigrantsImmigrantsAfghanistanAfricaAlbaniaArgentinaArmeniaAsiaAustraliaAustriaBahamasBangladeshBarbadosBelarusBelgiumBelizeBoliviaBosnia and HerzegovinaBrazilBulgariaBurma/MyanmarCabo VerdeCambodiaCameroonCanadaCentral AmericaChileChinaColombiaCongoCosta RicaCroatiaCubaCzechoslovakiaDenmarkDominicaDominican RepublicEastern AfricaEastern AsiaEastern EuropeEcuadorEgyptEl SalvadorEnglandEritreaEthiopiaEuropeFijiFranceGermanyGhanaGreeceGrenadaGuatemalaGuyanaHaitiHondurasHong KongHungaryIndiaIndonesiaIranIraqIrelandIsraelItalyJamaicaJapanJordanKazakhstanKenyaKoreaKuwaitLaosLatin AmericaLatviaLebanonLiberiaLithuaniaMalaysiaMexicoMicronesiaMiddle AfricaMoldovaMoroccoNepalNetherlandsNicaraguaNigeriaNorth AmericaNorth MacedoniaNorthern AfricaNorthern EuropeNorwayOceaniaPakistanPanamaPeruPhilippinesPolandPortugalRomaniaRussiaSaudi ArabiaScotlandSenegalSerbiaSierra LeoneSingaporeSomaliaSouth AfricaSouth AmericaSouth Central AsiaSouth Eastern AsiaSouthern EuropeSpainSri LankaSt. Vincent and the GrenadinesSudanSwedenSwitzerlandSyriaTaiwanThailandTrinidad and TobagoTurkeyUgandaUkraineUruguayUzbekistanVenezuelaVietnamWest IndiesWestern AfricaWestern AsiaWestern EuropeYemenZaireZimbabweAzores
Immigrants from Caribbean
Race
Ancestry
AfghanAfricanAlaska NativeAlaskan AthabascanAlbanianAleutAlsatianAmericanApacheArabArapahoArgentineanArmenianAssyrian/Chaldean/SyriacAustralianAustrianBahamianBangladeshiBarbadianBasqueBelgianBelizeanBermudanBhutaneseBlackfeetBolivianBrazilianBritishBritish West IndianBulgarianBurmeseCajunCambodianCanadianCape VerdeanCarpatho RusynCelticCentral AmericanCentral American IndianCherokeeCheyenneChickasawChileanChineseChippewaChoctawColombianColvilleComancheCosta RicanCreeCreekCroatianCrowCubanCypriotCzechCzechoslovakianDanishDelawareDominicanDutchDutch West IndianEastern EuropeanEcuadorianEgyptianEnglishEstonianEthiopianEuropeanFijianFilipinoFinnishFrenchFrench American IndianFrench CanadianGermanGerman RussianGhanaianGreekGuamanian/ChamorroGuatemalanGuyaneseHaitianHmongHonduranHopiHoumaHungarianIcelanderIndian (Asian)IndonesianInupiatIranianIraqiIrishIroquoisIsraeliItalianJamaicanJapaneseJordanianKenyanKiowaKoreanLaotianLatvianLiberianLithuanianLumbeeLuxembourgerMacedonianMalaysianMalteseMarshalleseMenomineeMexicanMexican American IndianMongolianMoroccanNative HawaiianNavajoNepaleseNew ZealanderNicaraguanNigerianNorthern EuropeanNorwegianOkinawanOsageOttawaPaiutePakistaniPalestinianPanamanianParaguayanPennsylvania GermanPeruvianPimaPolishPortuguesePotawatomiPuebloPuerto RicanPuget Sound SalishRomanianRussianSalvadoranSamoanScandinavianScotch-IrishScottishSeminoleSenegaleseSerbianShoshoneSierra LeoneanSiouxSlavicSlovakSloveneSomaliSouth AfricanSouth AmericanSouth American IndianSoviet UnionSpaniardSpanishSpanish AmericanSpanish American IndianSri LankanSubsaharan AfricanSudaneseSwedishSwissSyrianTaiwaneseThaiTlingit-HaidaTohono O'OdhamTonganTrinidadian and TobagonianTsimshianTurkishU.S. Virgin IslanderUgandanUkrainianUruguayanUteVenezuelanVietnameseWelshWest IndianYakamaYaquiYugoslavianYumanYup'ikZimbabwean
Immigration
NonimmigrantsImmigrantsAfghanistanAfricaAlbaniaArgentinaArmeniaAsiaAustraliaAustriaBahamasBangladeshBarbadosBelarusBelgiumBelizeBoliviaBosnia and HerzegovinaBrazilBulgariaBurma/MyanmarCabo VerdeCambodiaCameroonCanadaCaribbeanCentral AmericaChileChinaColombiaCongoCosta RicaCroatiaCubaCzechoslovakiaDenmarkDominicaDominican RepublicEastern AfricaEastern AsiaEastern EuropeEcuadorEgyptEl SalvadorEnglandEritreaEthiopiaEuropeFijiFranceGermanyGhanaGreeceGrenadaGuatemalaGuyanaHaitiHondurasHong KongHungaryIndiaIndonesiaIranIraqIrelandIsraelItalyJamaicaJapanJordanKazakhstanKenyaKoreaKuwaitLaosLatin AmericaLatviaLebanonLiberiaLithuaniaMalaysiaMexicoMicronesiaMiddle AfricaMoldovaMoroccoNepalNetherlandsNicaraguaNigeriaNorth AmericaNorth MacedoniaNorthern AfricaNorthern EuropeNorwayOceaniaPakistanPanamaPeruPhilippinesPolandPortugalRomaniaRussiaSaudi ArabiaScotlandSenegalSerbiaSierra LeoneSingaporeSomaliaSouth AfricaSouth AmericaSouth Central AsiaSouth Eastern AsiaSouthern EuropeSpainSri LankaSt. Vincent and the GrenadinesSudanSwedenSwitzerlandSyriaTaiwanThailandTrinidad and TobagoTurkeyUgandaUkraineUruguayUzbekistanVenezuelaVietnamWest IndiesWestern AfricaWestern AsiaWestern EuropeYemenZaireZimbabweAzores
Male Unemployment
Income
Poverty
Unemployment
Labor Participation
Family Structure
Vehicle Availability
Education Level
Disability

Male Unemployment Comparison

Lebanese

Immigrants from Caribbean

Good
Tragic
5.2%
MALE UNEMPLOYMENT
79.9/ 100
METRIC RATING
136th/ 347
METRIC RANK
6.3%
MALE UNEMPLOYMENT
0.0/ 100
METRIC RATING
289th/ 347
METRIC RANK

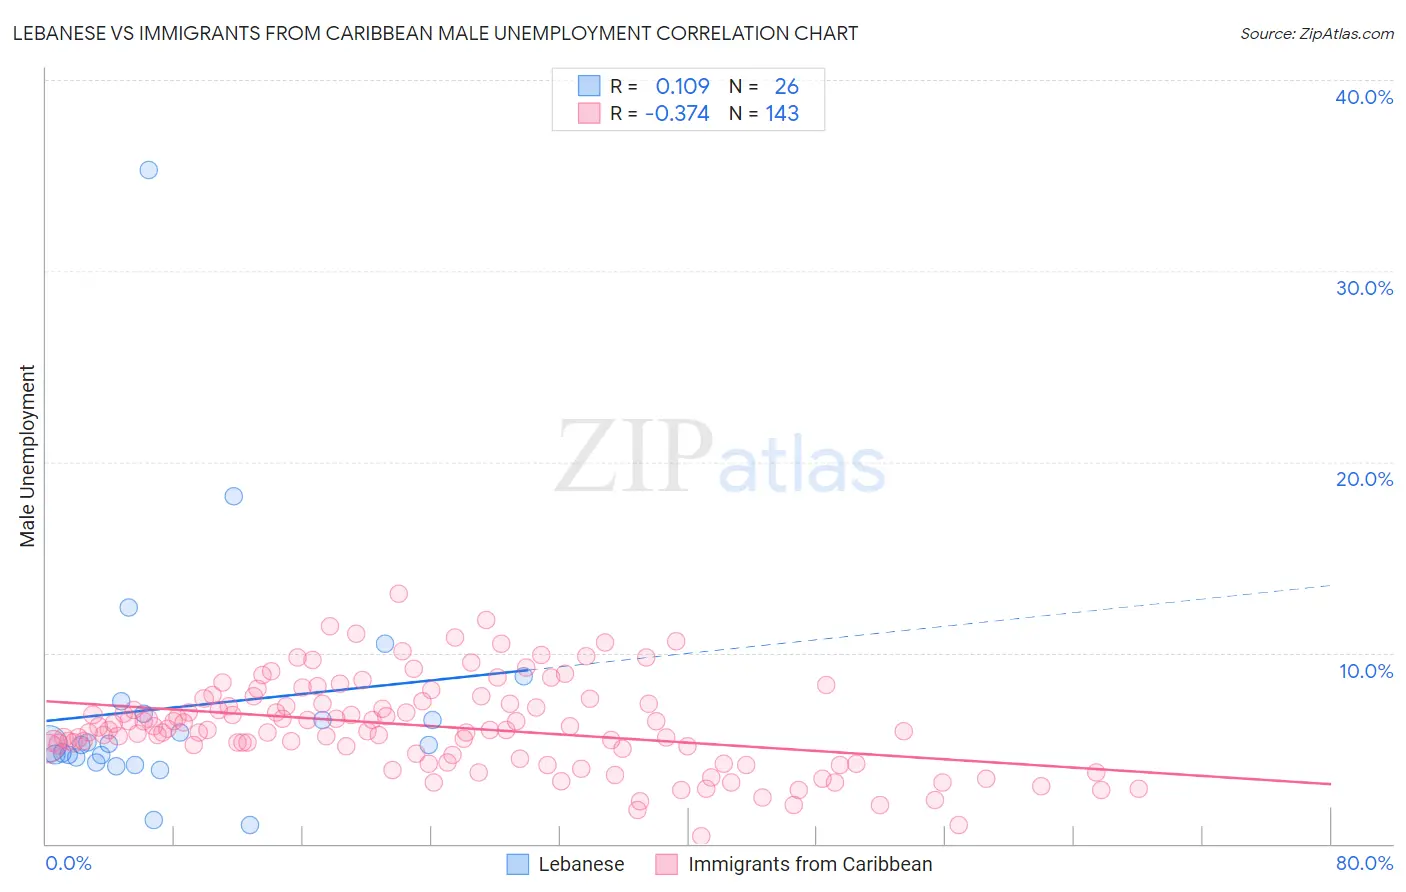
Lebanese vs Immigrants from Caribbean Male Unemployment Correlation Chart

The statistical analysis conducted on geographies consisting of 399,936,199 people shows a poor positive correlation between the proportion of Lebanese and unemployment rate among males in the United States with a correlation coefficient (R) of 0.109 and weighted average of 5.2%. Similarly, the statistical analysis conducted on geographies consisting of 447,554,684 people shows a mild negative correlation between the proportion of Immigrants from Caribbean and unemployment rate among males in the United States with a correlation coefficient (R) of -0.374 and weighted average of 6.3%, a difference of 21.1%.
Lebanese vs Immigrants from Caribbean Male Unemployment

Male Unemployment Correlation Summary

MeasurementLebaneseImmigrants from Caribbean
Minimum1.0%0.40%
Maximum35.3%13.1%
Range34.3%12.7%
Mean7.2%6.1%
Median5.2%6.0%
Interquartile 25% (IQ1)4.5%4.6%
Interquartile 75% (IQ3)6.8%7.5%
Interquartile Range (IQR)2.2%2.8%
Standard Deviation (Sample)6.7%2.4%
Standard Deviation (Population)6.6%2.3%

Similar Demographics by Male Unemployment

Demographics Similar to Lebanese by Male Unemployment

In terms of male unemployment, the demographic groups most similar to Lebanese are Immigrants from Eastern Africa (5.2%, a difference of 0.010%), Immigrants from Saudi Arabia (5.2%, a difference of 0.020%), Immigrants from Croatia (5.2%, a difference of 0.020%), Kenyan (5.2%, a difference of 0.040%), and Pakistani (5.2%, a difference of 0.050%).
DemographicsRating | RankMale Unemployment
Immigrants | Western Europe
84.8
/100
|
#129
Excellent
5.2%
Immigrants | Malaysia
83.5
/100
|
#130
Excellent
5.2%
Immigrants | Germany
83.0
/100
|
#131
Excellent
5.2%
Chickasaw
82.9
/100
|
#132
Excellent
5.2%
Colombians
81.1
/100
|
#133
Excellent
5.2%
Pakistanis
80.5
/100
|
#134
Excellent
5.2%
Immigrants | Saudi Arabia
80.1
/100
|
#135
Excellent
5.2%
Lebanese
79.9
/100
|
#136
Good
5.2%
Immigrants | Eastern Africa
79.8
/100
|
#137
Good
5.2%
Immigrants | Croatia
79.7
/100
|
#138
Good
5.2%
Kenyans
79.4
/100
|
#139
Good
5.2%
Brazilians
79.3
/100
|
#140
Good
5.2%
Immigrants | Switzerland
79.2
/100
|
#141
Good
5.2%
Fijians
78.3
/100
|
#142
Good
5.2%
Syrians
78.0
/100
|
#143
Good
5.2%

Demographics Similar to Immigrants from Caribbean by Male Unemployment

In terms of male unemployment, the demographic groups most similar to Immigrants from Caribbean are Immigrants from Senegal (6.3%, a difference of 0.12%), Central American Indian (6.3%, a difference of 0.16%), African (6.3%, a difference of 0.45%), Immigrants from Ecuador (6.2%, a difference of 0.88%), and Spanish American Indian (6.2%, a difference of 0.90%).
DemographicsRating | RankMale Unemployment
Ecuadorians
0.0
/100
|
#282
Tragic
6.2%
Immigrants | Western Africa
0.0
/100
|
#283
Tragic
6.2%
Spanish American Indians
0.0
/100
|
#284
Tragic
6.2%
Immigrants | Ecuador
0.0
/100
|
#285
Tragic
6.2%
Africans
0.0
/100
|
#286
Tragic
6.3%
Central American Indians
0.0
/100
|
#287
Tragic
6.3%
Immigrants | Senegal
0.0
/100
|
#288
Tragic
6.3%
Immigrants | Caribbean
0.0
/100
|
#289
Tragic
6.3%
U.S. Virgin Islanders
0.0
/100
|
#290
Tragic
6.4%
Immigrants | Azores
0.0
/100
|
#291
Tragic
6.4%
Nepalese
0.0
/100
|
#292
Tragic
6.4%
Haitians
0.0
/100
|
#293
Tragic
6.4%
Senegalese
0.0
/100
|
#294
Tragic
6.4%
Belizeans
0.0
/100
|
#295
Tragic
6.5%
Immigrants | Haiti
0.0
/100
|
#296
Tragic
6.5%