Cree vs Immigrants from Korea Female Unemployment
COMPARE
Cree
Immigrants from Korea
Female Unemployment
Female Unemployment Comparison
Cree
Immigrants from Korea
5.6%
FEMALE UNEMPLOYMENT
1.0/ 100
METRIC RATING
248th/ 347
METRIC RANK
5.1%
FEMALE UNEMPLOYMENT
86.3/ 100
METRIC RATING
126th/ 347
METRIC RANK
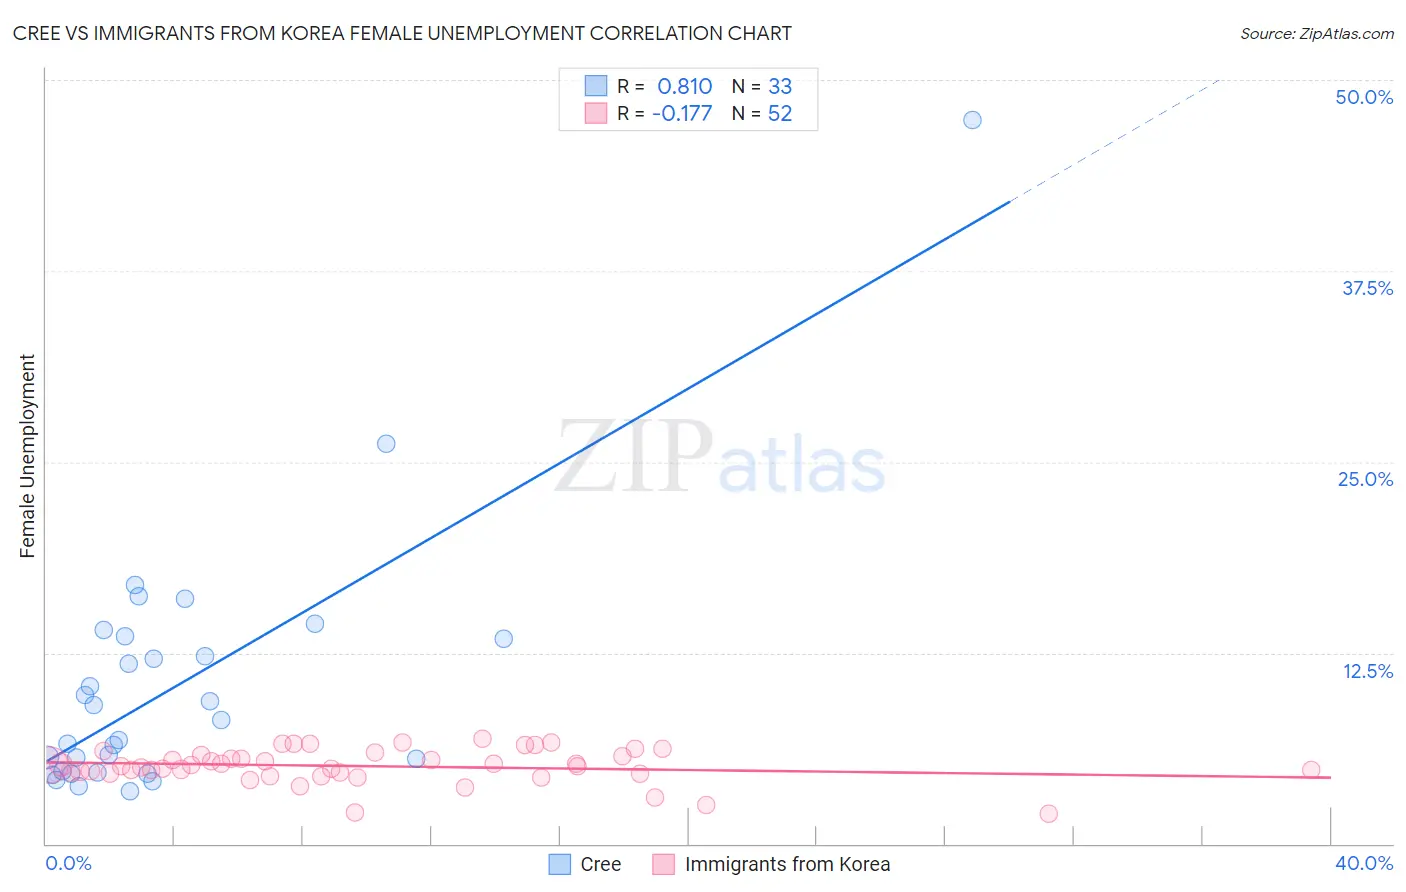
Cree vs Immigrants from Korea Female Unemployment Correlation Chart
The statistical analysis conducted on geographies consisting of 76,053,409 people shows a very strong positive correlation between the proportion of Cree and unemploymnet rate among females in the United States with a correlation coefficient (R) of 0.810 and weighted average of 5.6%. Similarly, the statistical analysis conducted on geographies consisting of 414,293,995 people shows a poor negative correlation between the proportion of Immigrants from Korea and unemploymnet rate among females in the United States with a correlation coefficient (R) of -0.177 and weighted average of 5.1%, a difference of 9.9%.
Female Unemployment Correlation Summary
| Measurement | Cree | Immigrants from Korea |
| Minimum | 3.4% | 2.0% |
| Maximum | 47.4% | 6.9% |
| Range | 44.0% | 4.9% |
| Mean | 10.4% | 5.1% |
| Median | 8.1% | 5.1% |
| Interquartile 25% (IQ1) | 4.7% | 4.7% |
| Interquartile 75% (IQ3) | 13.5% | 5.8% |
| Interquartile Range (IQR) | 8.8% | 1.1% |
| Standard Deviation (Sample) | 8.4% | 1.1% |
| Standard Deviation (Population) | 8.3% | 1.1% |
Similar Demographics by Female Unemployment
Demographics Similar to Cree by Female Unemployment
In terms of female unemployment, the demographic groups most similar to Cree are Immigrants from Uzbekistan (5.6%, a difference of 0.040%), Immigrants from Western Asia (5.6%, a difference of 0.16%), Japanese (5.6%, a difference of 0.24%), Immigrants from Syria (5.6%, a difference of 0.33%), and Assyrian/Chaldean/Syriac (5.6%, a difference of 0.39%).
| Demographics | Rating | Rank | Female Unemployment |
| South American Indians | 2.8 /100 | #241 | Tragic 5.5% |
| Marshallese | 2.3 /100 | #242 | Tragic 5.6% |
| Spanish Americans | 2.2 /100 | #243 | Tragic 5.6% |
| Immigrants | Liberia | 1.5 /100 | #244 | Tragic 5.6% |
| Guamanians/Chamorros | 1.4 /100 | #245 | Tragic 5.6% |
| Japanese | 1.2 /100 | #246 | Tragic 5.6% |
| Immigrants | Western Asia | 1.1 /100 | #247 | Tragic 5.6% |
| Cree | 1.0 /100 | #248 | Tragic 5.6% |
| Immigrants | Uzbekistan | 1.0 /100 | #249 | Tragic 5.6% |
| Immigrants | Syria | 0.8 /100 | #250 | Tragic 5.6% |
| Assyrians/Chaldeans/Syriacs | 0.8 /100 | #251 | Tragic 5.6% |
| Cajuns | 0.7 /100 | #252 | Tragic 5.7% |
| Immigrants | Sierra Leone | 0.6 /100 | #253 | Tragic 5.7% |
| Immigrants | Immigrants | 0.6 /100 | #254 | Tragic 5.7% |
| Immigrants | Cameroon | 0.6 /100 | #255 | Tragic 5.7% |
Demographics Similar to Immigrants from Korea by Female Unemployment
In terms of female unemployment, the demographic groups most similar to Immigrants from Korea are Basque (5.1%, a difference of 0.020%), Immigrants from Hungary (5.1%, a difference of 0.040%), Chilean (5.1%, a difference of 0.070%), Ethiopian (5.1%, a difference of 0.080%), and Maltese (5.1%, a difference of 0.10%).
| Demographics | Rating | Rank | Female Unemployment |
| Immigrants | North Macedonia | 88.3 /100 | #119 | Excellent 5.1% |
| Immigrants | Romania | 88.1 /100 | #120 | Excellent 5.1% |
| Immigrants | Western Europe | 88.1 /100 | #121 | Excellent 5.1% |
| Immigrants | Germany | 87.6 /100 | #122 | Excellent 5.1% |
| Immigrants | South Africa | 87.6 /100 | #123 | Excellent 5.1% |
| Immigrants | Europe | 87.2 /100 | #124 | Excellent 5.1% |
| Basques | 86.5 /100 | #125 | Excellent 5.1% |
| Immigrants | Korea | 86.3 /100 | #126 | Excellent 5.1% |
| Immigrants | Hungary | 86.0 /100 | #127 | Excellent 5.1% |
| Chileans | 85.8 /100 | #128 | Excellent 5.1% |
| Ethiopians | 85.7 /100 | #129 | Excellent 5.1% |
| Maltese | 85.5 /100 | #130 | Excellent 5.1% |
| Immigrants | Ethiopia | 85.4 /100 | #131 | Excellent 5.1% |
| Immigrants | Sri Lanka | 85.0 /100 | #132 | Excellent 5.1% |
| Immigrants | Hong Kong | 84.8 /100 | #133 | Excellent 5.1% |