Black/African American vs Immigrants from Barbados Doctorate Degree
COMPARE
Black/African American
Immigrants from Barbados
Doctorate Degree
Doctorate Degree Comparison
Blacks/African Americans
Immigrants from Barbados
1.4%
DOCTORATE DEGREE
0.3/ 100
METRIC RATING
291st/ 347
METRIC RANK
1.5%
DOCTORATE DEGREE
0.4/ 100
METRIC RATING
272nd/ 347
METRIC RANK
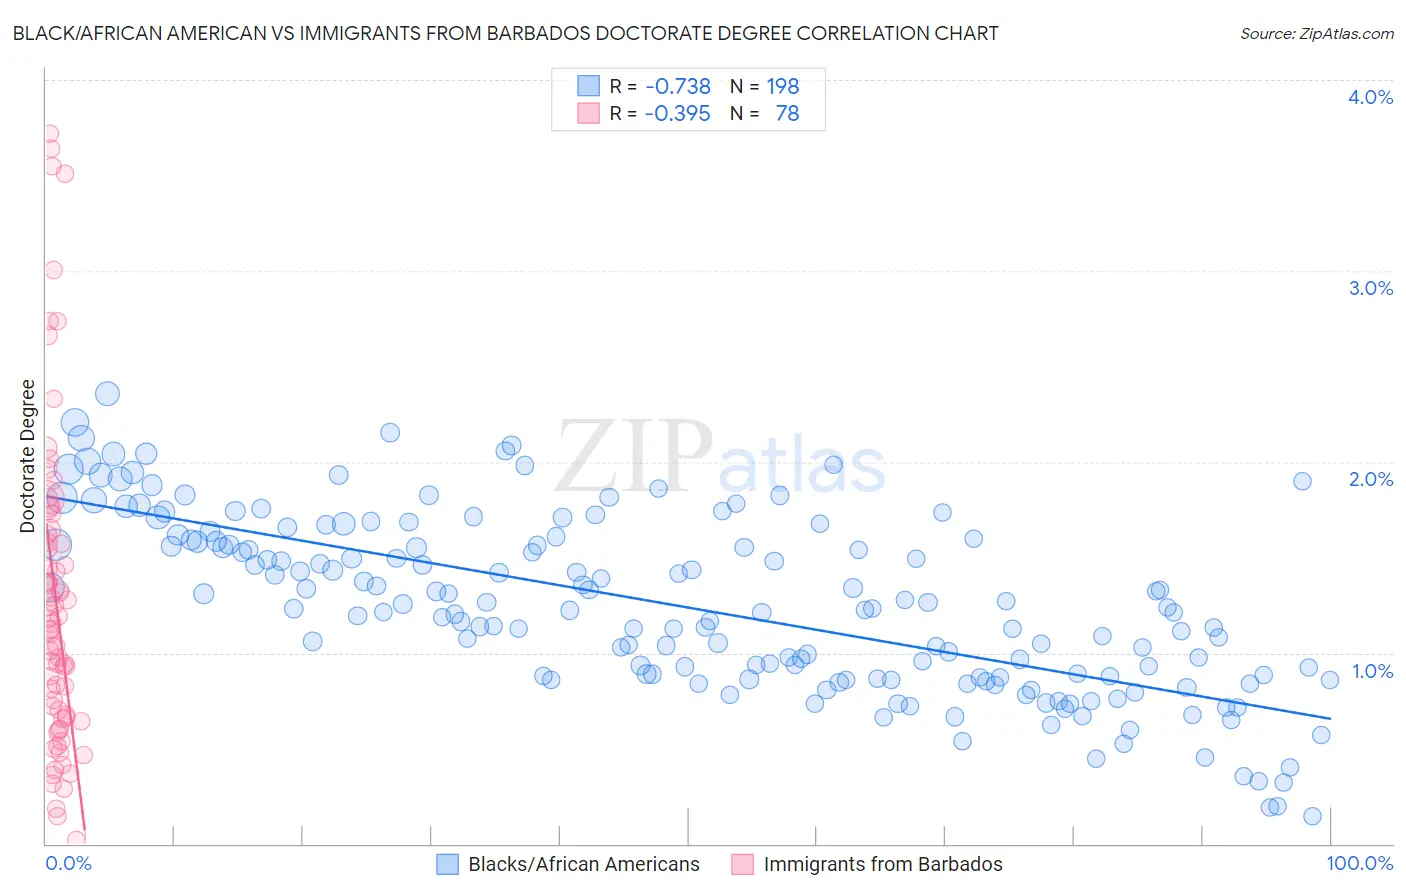
Black/African American vs Immigrants from Barbados Doctorate Degree Correlation Chart
The statistical analysis conducted on geographies consisting of 542,418,709 people shows a strong negative correlation between the proportion of Blacks/African Americans and percentage of population with at least doctorate degree education in the United States with a correlation coefficient (R) of -0.738 and weighted average of 1.4%. Similarly, the statistical analysis conducted on geographies consisting of 112,445,982 people shows a mild negative correlation between the proportion of Immigrants from Barbados and percentage of population with at least doctorate degree education in the United States with a correlation coefficient (R) of -0.395 and weighted average of 1.5%, a difference of 2.2%.
Doctorate Degree Correlation Summary
| Measurement | Black/African American | Immigrants from Barbados |
| Minimum | 0.15% | 0.017% |
| Maximum | 2.4% | 3.7% |
| Range | 2.2% | 3.7% |
| Mean | 1.2% | 1.3% |
| Median | 1.2% | 1.1% |
| Interquartile 25% (IQ1) | 0.87% | 0.66% |
| Interquartile 75% (IQ3) | 1.6% | 1.6% |
| Interquartile Range (IQR) | 0.71% | 0.96% |
| Standard Deviation (Sample) | 0.46% | 0.84% |
| Standard Deviation (Population) | 0.46% | 0.83% |
Demographics Similar to Blacks/African Americans and Immigrants from Barbados by Doctorate Degree
In terms of doctorate degree, the demographic groups most similar to Blacks/African Americans are Choctaw (1.4%, a difference of 0.23%), Cape Verdean (1.4%, a difference of 0.24%), Immigrants from El Salvador (1.4%, a difference of 0.38%), Cajun (1.5%, a difference of 0.56%), and Cherokee (1.5%, a difference of 0.72%). Similarly, the demographic groups most similar to Immigrants from Barbados are Immigrants from Trinidad and Tobago (1.5%, a difference of 0.090%), Sioux (1.5%, a difference of 0.11%), Yaqui (1.5%, a difference of 0.13%), Aleut (1.5%, a difference of 0.25%), and Paiute (1.5%, a difference of 0.30%).
| Demographics | Rating | Rank | Doctorate Degree |
| Immigrants | Trinidad and Tobago | 0.5 /100 | #271 | Tragic 1.5% |
| Immigrants | Barbados | 0.4 /100 | #272 | Tragic 1.5% |
| Sioux | 0.4 /100 | #273 | Tragic 1.5% |
| Yaqui | 0.4 /100 | #274 | Tragic 1.5% |
| Aleuts | 0.4 /100 | #275 | Tragic 1.5% |
| Paiute | 0.4 /100 | #276 | Tragic 1.5% |
| Bahamians | 0.4 /100 | #277 | Tragic 1.5% |
| Hawaiians | 0.4 /100 | #278 | Tragic 1.5% |
| Marshallese | 0.4 /100 | #279 | Tragic 1.5% |
| Ecuadorians | 0.4 /100 | #280 | Tragic 1.5% |
| Tohono O'odham | 0.4 /100 | #281 | Tragic 1.5% |
| British West Indians | 0.3 /100 | #282 | Tragic 1.5% |
| Central Americans | 0.3 /100 | #283 | Tragic 1.5% |
| Jamaicans | 0.3 /100 | #284 | Tragic 1.5% |
| Malaysians | 0.3 /100 | #285 | Tragic 1.5% |
| Cherokee | 0.3 /100 | #286 | Tragic 1.5% |
| Cajuns | 0.3 /100 | #287 | Tragic 1.5% |
| Immigrants | El Salvador | 0.3 /100 | #288 | Tragic 1.4% |
| Cape Verdeans | 0.3 /100 | #289 | Tragic 1.4% |
| Choctaw | 0.3 /100 | #290 | Tragic 1.4% |
| Blacks/African Americans | 0.3 /100 | #291 | Tragic 1.4% |