Belizean vs Mongolian Male Unemployment
COMPARE
Belizean
Mongolian
Male Unemployment
Male Unemployment Comparison
Belizeans
Mongolians
6.5%
MALE UNEMPLOYMENT
0.0/ 100
METRIC RATING
295th/ 347
METRIC RANK
5.1%
MALE UNEMPLOYMENT
88.4/ 100
METRIC RATING
121st/ 347
METRIC RANK
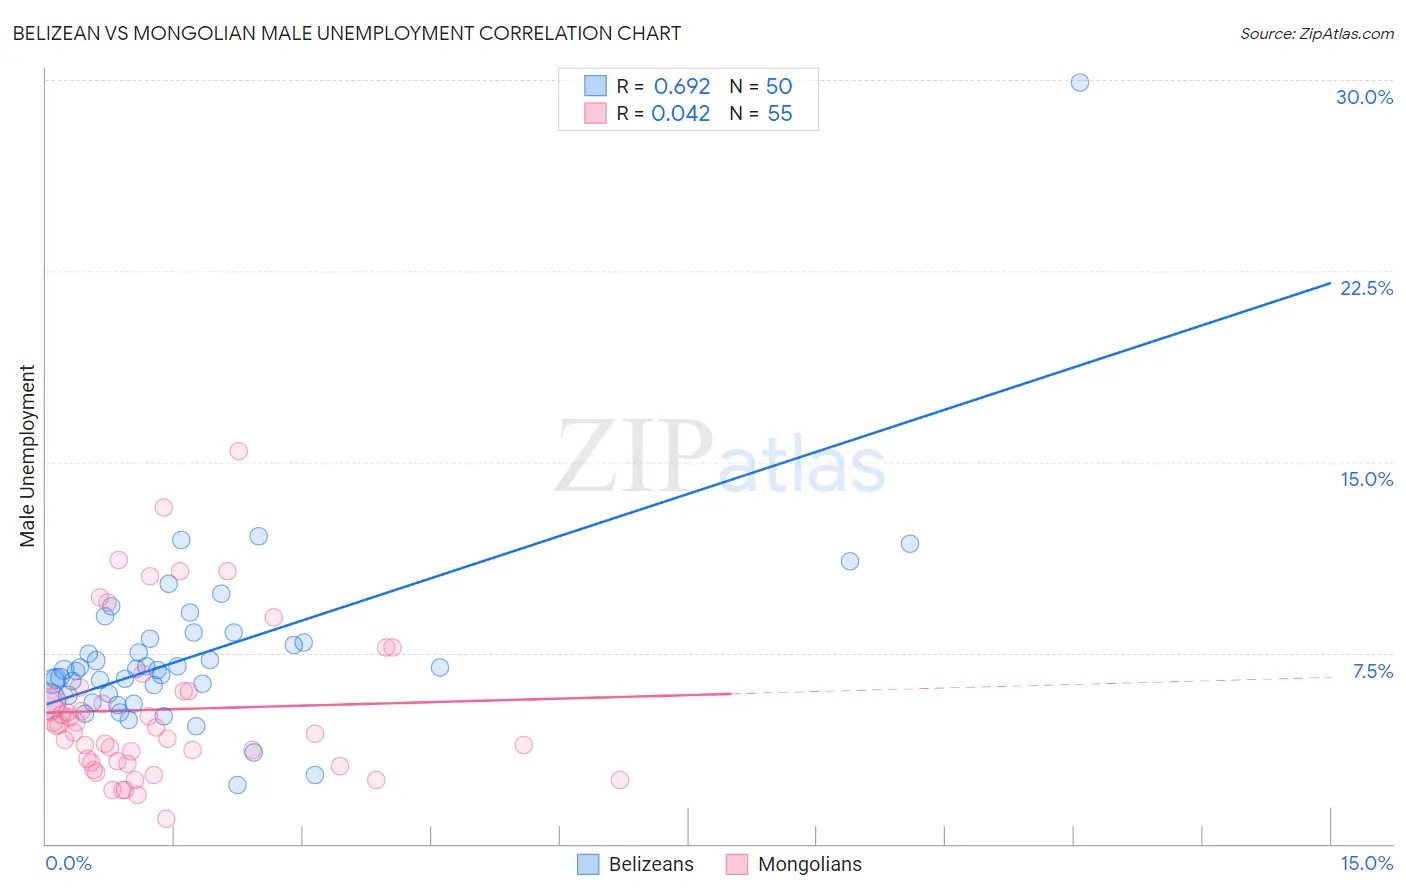
Belizean vs Mongolian Male Unemployment Correlation Chart
The statistical analysis conducted on geographies consisting of 144,079,260 people shows a significant positive correlation between the proportion of Belizeans and unemployment rate among males in the United States with a correlation coefficient (R) of 0.692 and weighted average of 6.5%. Similarly, the statistical analysis conducted on geographies consisting of 140,285,925 people shows no correlation between the proportion of Mongolians and unemployment rate among males in the United States with a correlation coefficient (R) of 0.042 and weighted average of 5.1%, a difference of 26.5%.
Male Unemployment Correlation Summary
| Measurement | Belizean | Mongolian |
| Minimum | 2.3% | 1.0% |
| Maximum | 29.9% | 15.4% |
| Range | 27.6% | 14.4% |
| Mean | 7.5% | 5.3% |
| Median | 6.8% | 4.6% |
| Interquartile 25% (IQ1) | 5.8% | 3.2% |
| Interquartile 75% (IQ3) | 8.1% | 6.0% |
| Interquartile Range (IQR) | 2.2% | 2.8% |
| Standard Deviation (Sample) | 3.9% | 3.0% |
| Standard Deviation (Population) | 3.8% | 3.0% |
Similar Demographics by Male Unemployment
Demographics Similar to Belizeans by Male Unemployment
In terms of male unemployment, the demographic groups most similar to Belizeans are Immigrants from Haiti (6.5%, a difference of 0.45%), Chippewa (6.6%, a difference of 0.77%), Senegalese (6.4%, a difference of 0.85%), Jamaican (6.6%, a difference of 0.85%), and Haitian (6.4%, a difference of 0.96%).
| Demographics | Rating | Rank | Male Unemployment |
| Immigrants | Senegal | 0.0 /100 | #288 | Tragic 6.3% |
| Immigrants | Caribbean | 0.0 /100 | #289 | Tragic 6.3% |
| U.S. Virgin Islanders | 0.0 /100 | #290 | Tragic 6.4% |
| Immigrants | Azores | 0.0 /100 | #291 | Tragic 6.4% |
| Nepalese | 0.0 /100 | #292 | Tragic 6.4% |
| Haitians | 0.0 /100 | #293 | Tragic 6.4% |
| Senegalese | 0.0 /100 | #294 | Tragic 6.4% |
| Belizeans | 0.0 /100 | #295 | Tragic 6.5% |
| Immigrants | Haiti | 0.0 /100 | #296 | Tragic 6.5% |
| Chippewa | 0.0 /100 | #297 | Tragic 6.6% |
| Jamaicans | 0.0 /100 | #298 | Tragic 6.6% |
| Immigrants | Bangladesh | 0.0 /100 | #299 | Tragic 6.6% |
| Vietnamese | 0.0 /100 | #300 | Tragic 6.6% |
| Immigrants | Belize | 0.0 /100 | #301 | Tragic 6.6% |
| Ute | 0.0 /100 | #302 | Tragic 6.6% |
Demographics Similar to Mongolians by Male Unemployment
In terms of male unemployment, the demographic groups most similar to Mongolians are Ukrainian (5.1%, a difference of 0.010%), French Canadian (5.1%, a difference of 0.030%), Nicaraguan (5.1%, a difference of 0.030%), Cypriot (5.1%, a difference of 0.070%), and Estonian (5.1%, a difference of 0.10%).
| Demographics | Rating | Rank | Male Unemployment |
| Romanians | 89.8 /100 | #114 | Excellent 5.1% |
| Immigrants | Asia | 89.6 /100 | #115 | Excellent 5.1% |
| Immigrants | Denmark | 89.4 /100 | #116 | Excellent 5.1% |
| Estonians | 89.0 /100 | #117 | Excellent 5.1% |
| Cypriots | 88.8 /100 | #118 | Excellent 5.1% |
| French Canadians | 88.6 /100 | #119 | Excellent 5.1% |
| Ukrainians | 88.4 /100 | #120 | Excellent 5.1% |
| Mongolians | 88.4 /100 | #121 | Excellent 5.1% |
| Nicaraguans | 88.2 /100 | #122 | Excellent 5.1% |
| Palestinians | 87.7 /100 | #123 | Excellent 5.1% |
| Immigrants | Latvia | 87.5 /100 | #124 | Excellent 5.1% |
| Immigrants | Lithuania | 87.2 /100 | #125 | Excellent 5.1% |
| Immigrants | Colombia | 86.8 /100 | #126 | Excellent 5.1% |
| Immigrants | Brazil | 86.3 /100 | #127 | Excellent 5.2% |
| Hungarians | 85.1 /100 | #128 | Excellent 5.2% |