Belizean vs Costa Rican Male Unemployment
COMPARE
Belizean
Costa Rican
Male Unemployment
Male Unemployment Comparison
Belizeans
Costa Ricans
6.5%
MALE UNEMPLOYMENT
0.0/ 100
METRIC RATING
295th/ 347
METRIC RANK
5.4%
MALE UNEMPLOYMENT
31.3/ 100
METRIC RATING
187th/ 347
METRIC RANK
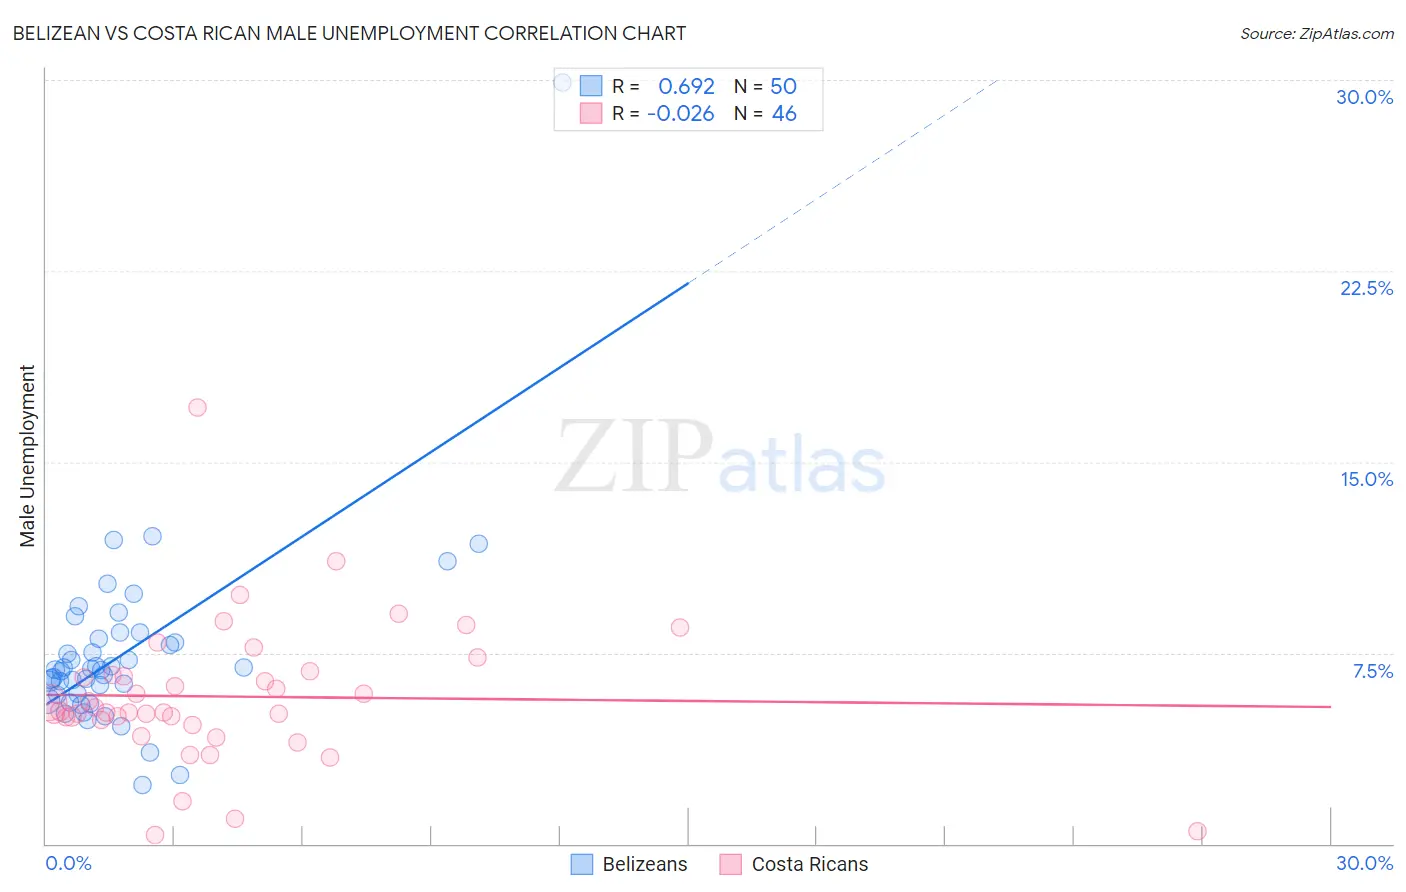
Belizean vs Costa Rican Male Unemployment Correlation Chart
The statistical analysis conducted on geographies consisting of 144,079,260 people shows a significant positive correlation between the proportion of Belizeans and unemployment rate among males in the United States with a correlation coefficient (R) of 0.692 and weighted average of 6.5%. Similarly, the statistical analysis conducted on geographies consisting of 253,200,475 people shows no correlation between the proportion of Costa Ricans and unemployment rate among males in the United States with a correlation coefficient (R) of -0.026 and weighted average of 5.4%, a difference of 21.4%.
Male Unemployment Correlation Summary
| Measurement | Belizean | Costa Rican |
| Minimum | 2.3% | 0.35% |
| Maximum | 29.9% | 17.2% |
| Range | 27.6% | 16.8% |
| Mean | 7.5% | 5.8% |
| Median | 6.8% | 5.2% |
| Interquartile 25% (IQ1) | 5.8% | 4.9% |
| Interquartile 75% (IQ3) | 8.1% | 6.6% |
| Interquartile Range (IQR) | 2.2% | 1.8% |
| Standard Deviation (Sample) | 3.9% | 2.8% |
| Standard Deviation (Population) | 3.8% | 2.8% |
Similar Demographics by Male Unemployment
Demographics Similar to Belizeans by Male Unemployment
In terms of male unemployment, the demographic groups most similar to Belizeans are Immigrants from Haiti (6.5%, a difference of 0.45%), Chippewa (6.6%, a difference of 0.77%), Senegalese (6.4%, a difference of 0.85%), Jamaican (6.6%, a difference of 0.85%), and Haitian (6.4%, a difference of 0.96%).
| Demographics | Rating | Rank | Male Unemployment |
| Immigrants | Senegal | 0.0 /100 | #288 | Tragic 6.3% |
| Immigrants | Caribbean | 0.0 /100 | #289 | Tragic 6.3% |
| U.S. Virgin Islanders | 0.0 /100 | #290 | Tragic 6.4% |
| Immigrants | Azores | 0.0 /100 | #291 | Tragic 6.4% |
| Nepalese | 0.0 /100 | #292 | Tragic 6.4% |
| Haitians | 0.0 /100 | #293 | Tragic 6.4% |
| Senegalese | 0.0 /100 | #294 | Tragic 6.4% |
| Belizeans | 0.0 /100 | #295 | Tragic 6.5% |
| Immigrants | Haiti | 0.0 /100 | #296 | Tragic 6.5% |
| Chippewa | 0.0 /100 | #297 | Tragic 6.6% |
| Jamaicans | 0.0 /100 | #298 | Tragic 6.6% |
| Immigrants | Bangladesh | 0.0 /100 | #299 | Tragic 6.6% |
| Vietnamese | 0.0 /100 | #300 | Tragic 6.6% |
| Immigrants | Belize | 0.0 /100 | #301 | Tragic 6.6% |
| Ute | 0.0 /100 | #302 | Tragic 6.6% |
Demographics Similar to Costa Ricans by Male Unemployment
In terms of male unemployment, the demographic groups most similar to Costa Ricans are Iraqi (5.4%, a difference of 0.010%), Arab (5.4%, a difference of 0.080%), Immigrants from South America (5.4%, a difference of 0.13%), Immigrants from Uganda (5.4%, a difference of 0.18%), and Immigrants from South Eastern Asia (5.4%, a difference of 0.21%).
| Demographics | Rating | Rank | Male Unemployment |
| Malaysians | 39.6 /100 | #180 | Fair 5.3% |
| Immigrants | Afghanistan | 37.9 /100 | #181 | Fair 5.3% |
| Potawatomi | 37.8 /100 | #182 | Fair 5.3% |
| Taiwanese | 37.6 /100 | #183 | Fair 5.3% |
| Spaniards | 35.1 /100 | #184 | Fair 5.3% |
| Koreans | 34.9 /100 | #185 | Fair 5.3% |
| Iraqis | 31.6 /100 | #186 | Fair 5.4% |
| Costa Ricans | 31.3 /100 | #187 | Fair 5.4% |
| Arabs | 30.2 /100 | #188 | Fair 5.4% |
| Immigrants | South America | 29.4 /100 | #189 | Fair 5.4% |
| Immigrants | Uganda | 28.8 /100 | #190 | Fair 5.4% |
| Immigrants | South Eastern Asia | 28.2 /100 | #191 | Fair 5.4% |
| Immigrants | Belarus | 26.0 /100 | #192 | Fair 5.4% |
| Immigrants | Israel | 25.2 /100 | #193 | Fair 5.4% |
| Spanish | 19.7 /100 | #194 | Poor 5.4% |