Assyrian/Chaldean/Syriac vs Lithuanian Unemployment Among Seniors over 65 years
COMPARE
Assyrian/Chaldean/Syriac
Lithuanian
Unemployment Among Seniors over 65 years
Unemployment Among Seniors over 65 years Comparison
Assyrians/Chaldeans/Syriacs
Lithuanians
5.0%
UNEMPLOYMENT AMONG SENIORS OVER 65 YEARS
96.8/ 100
METRIC RATING
95th/ 347
METRIC RANK
5.1%
UNEMPLOYMENT AMONG SENIORS OVER 65 YEARS
58.2/ 100
METRIC RATING
169th/ 347
METRIC RANK
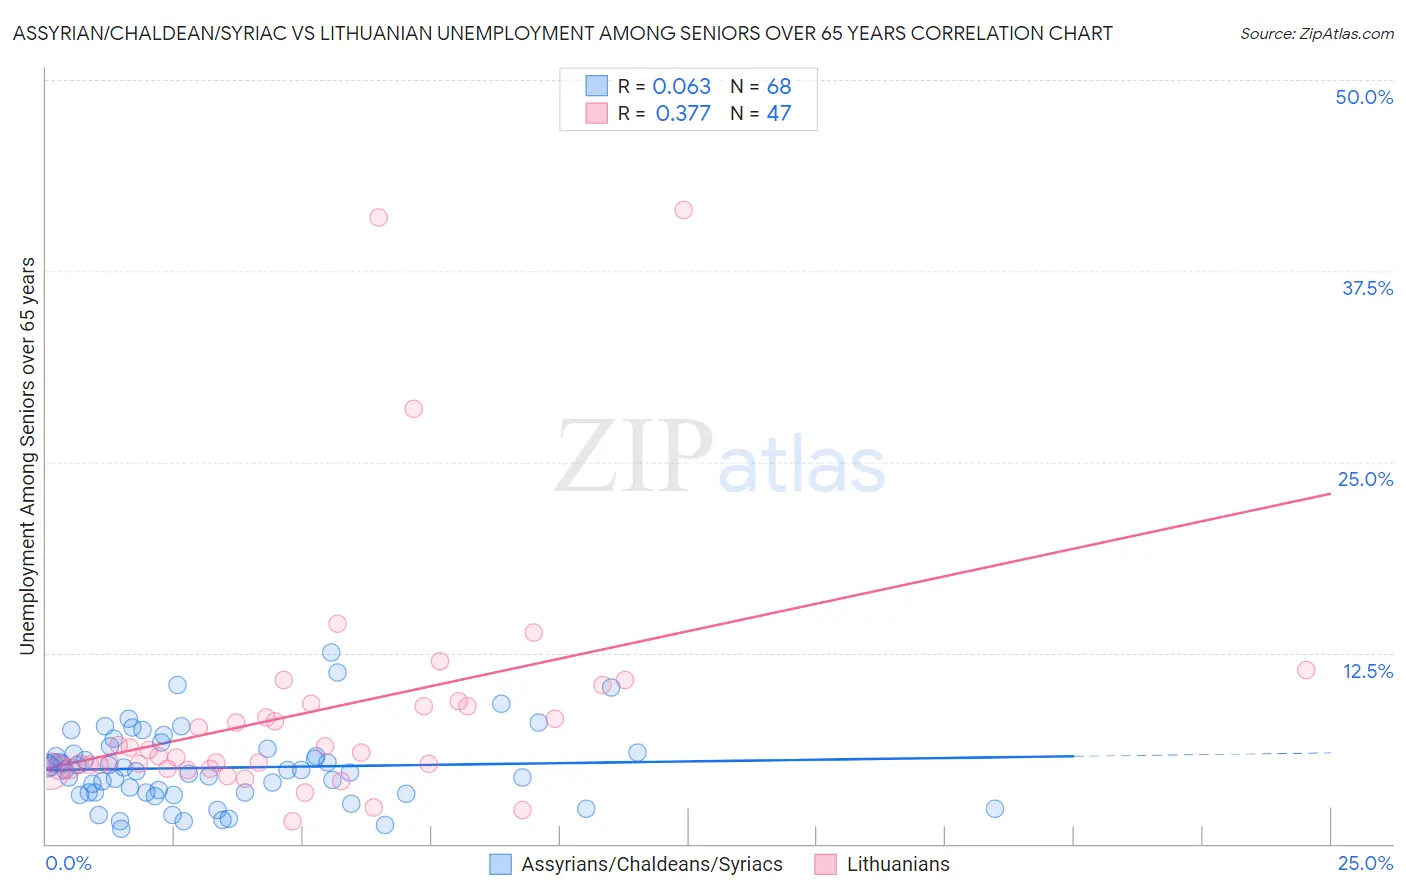
Assyrian/Chaldean/Syriac vs Lithuanian Unemployment Among Seniors over 65 years Correlation Chart
The statistical analysis conducted on geographies consisting of 107,075,220 people shows a slight positive correlation between the proportion of Assyrians/Chaldeans/Syriacs and unemployment rate amomg seniors over the age of 65 in the United States with a correlation coefficient (R) of 0.063 and weighted average of 5.0%. Similarly, the statistical analysis conducted on geographies consisting of 374,267,486 people shows a mild positive correlation between the proportion of Lithuanians and unemployment rate amomg seniors over the age of 65 in the United States with a correlation coefficient (R) of 0.377 and weighted average of 5.1%, a difference of 2.5%.
Unemployment Among Seniors over 65 years Correlation Summary
| Measurement | Assyrian/Chaldean/Syriac | Lithuanian |
| Minimum | 1.0% | 1.5% |
| Maximum | 12.5% | 41.5% |
| Range | 11.5% | 40.0% |
| Mean | 5.0% | 8.7% |
| Median | 4.8% | 6.0% |
| Interquartile 25% (IQ1) | 3.4% | 4.9% |
| Interquartile 75% (IQ3) | 6.1% | 9.2% |
| Interquartile Range (IQR) | 2.7% | 4.3% |
| Standard Deviation (Sample) | 2.4% | 8.1% |
| Standard Deviation (Population) | 2.4% | 8.1% |
Similar Demographics by Unemployment Among Seniors over 65 years
Demographics Similar to Assyrians/Chaldeans/Syriacs by Unemployment Among Seniors over 65 years
In terms of unemployment among seniors over 65 years, the demographic groups most similar to Assyrians/Chaldeans/Syriacs are Immigrants from Singapore (5.0%, a difference of 0.0%), Burmese (5.0%, a difference of 0.010%), Immigrants from Oceania (5.0%, a difference of 0.010%), Czechoslovakian (5.0%, a difference of 0.010%), and South African (5.0%, a difference of 0.070%).
| Demographics | Rating | Rank | Unemployment Among Seniors over 65 years |
| Afghans | 97.6 /100 | #88 | Exceptional 5.0% |
| Immigrants | South Central Asia | 97.6 /100 | #89 | Exceptional 5.0% |
| Immigrants | South Africa | 97.6 /100 | #90 | Exceptional 5.0% |
| Immigrants | Bolivia | 97.3 /100 | #91 | Exceptional 5.0% |
| Immigrants | Bulgaria | 97.3 /100 | #92 | Exceptional 5.0% |
| Austrians | 97.3 /100 | #93 | Exceptional 5.0% |
| Burmese | 96.8 /100 | #94 | Exceptional 5.0% |
| Assyrians/Chaldeans/Syriacs | 96.8 /100 | #95 | Exceptional 5.0% |
| Immigrants | Singapore | 96.8 /100 | #96 | Exceptional 5.0% |
| Immigrants | Oceania | 96.8 /100 | #97 | Exceptional 5.0% |
| Czechoslovakians | 96.7 /100 | #98 | Exceptional 5.0% |
| South Africans | 96.5 /100 | #99 | Exceptional 5.0% |
| Romanians | 95.5 /100 | #100 | Exceptional 5.0% |
| Yugoslavians | 95.4 /100 | #101 | Exceptional 5.0% |
| Immigrants | Thailand | 95.4 /100 | #102 | Exceptional 5.0% |
Demographics Similar to Lithuanians by Unemployment Among Seniors over 65 years
In terms of unemployment among seniors over 65 years, the demographic groups most similar to Lithuanians are Mongolian (5.1%, a difference of 0.050%), Immigrants from Western Europe (5.1%, a difference of 0.070%), Immigrants from Eastern Asia (5.1%, a difference of 0.11%), Nonimmigrants (5.1%, a difference of 0.13%), and Immigrants from Ireland (5.1%, a difference of 0.16%).
| Demographics | Rating | Rank | Unemployment Among Seniors over 65 years |
| Immigrants | South Eastern Asia | 65.6 /100 | #162 | Good 5.1% |
| Potawatomi | 64.5 /100 | #163 | Good 5.1% |
| Nepalese | 64.5 /100 | #164 | Good 5.1% |
| Immigrants | Ukraine | 64.2 /100 | #165 | Good 5.1% |
| Immigrants | Laos | 63.8 /100 | #166 | Good 5.1% |
| Immigrants | Western Europe | 60.4 /100 | #167 | Good 5.1% |
| Mongolians | 59.8 /100 | #168 | Average 5.1% |
| Lithuanians | 58.2 /100 | #169 | Average 5.1% |
| Immigrants | Eastern Asia | 54.9 /100 | #170 | Average 5.1% |
| Immigrants | Nonimmigrants | 54.1 /100 | #171 | Average 5.1% |
| Immigrants | Ireland | 53.2 /100 | #172 | Average 5.1% |
| Immigrants | Spain | 51.7 /100 | #173 | Average 5.1% |
| Spanish Americans | 50.0 /100 | #174 | Average 5.1% |
| Immigrants | Eastern Europe | 49.8 /100 | #175 | Average 5.1% |
| Indians (Asian) | 46.6 /100 | #176 | Average 5.2% |