Immigrants from Burma/Myanmar vs Lithuanian Unemployment Among Seniors over 65 years
COMPARE
Immigrants from Burma/Myanmar
Lithuanian
Unemployment Among Seniors over 65 years
Unemployment Among Seniors over 65 years Comparison
Immigrants from Burma/Myanmar
Lithuanians
4.6%
UNEMPLOYMENT AMONG SENIORS OVER 65 YEARS
100.0/ 100
METRIC RATING
16th/ 347
METRIC RANK
5.1%
UNEMPLOYMENT AMONG SENIORS OVER 65 YEARS
58.2/ 100
METRIC RATING
169th/ 347
METRIC RANK
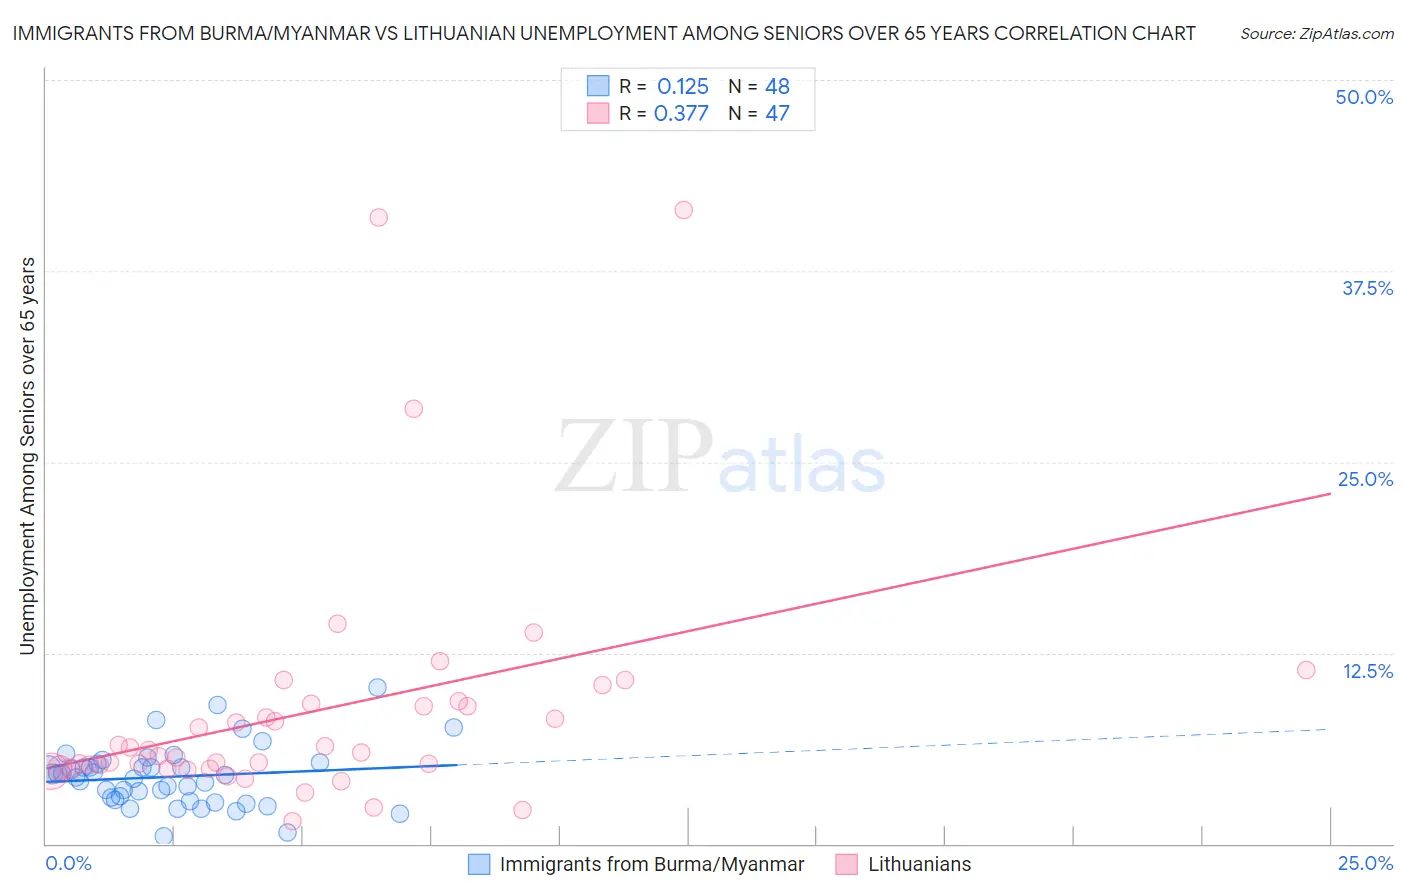
Immigrants from Burma/Myanmar vs Lithuanian Unemployment Among Seniors over 65 years Correlation Chart
The statistical analysis conducted on geographies consisting of 164,420,398 people shows a poor positive correlation between the proportion of Immigrants from Burma/Myanmar and unemployment rate amomg seniors over the age of 65 in the United States with a correlation coefficient (R) of 0.125 and weighted average of 4.6%. Similarly, the statistical analysis conducted on geographies consisting of 374,267,486 people shows a mild positive correlation between the proportion of Lithuanians and unemployment rate amomg seniors over the age of 65 in the United States with a correlation coefficient (R) of 0.377 and weighted average of 5.1%, a difference of 10.8%.
Unemployment Among Seniors over 65 years Correlation Summary
| Measurement | Immigrants from Burma/Myanmar | Lithuanian |
| Minimum | 0.53% | 1.5% |
| Maximum | 10.2% | 41.5% |
| Range | 9.7% | 40.0% |
| Mean | 4.4% | 8.7% |
| Median | 4.4% | 6.0% |
| Interquartile 25% (IQ1) | 3.0% | 4.9% |
| Interquartile 75% (IQ3) | 5.1% | 9.2% |
| Interquartile Range (IQR) | 2.2% | 4.3% |
| Standard Deviation (Sample) | 2.0% | 8.1% |
| Standard Deviation (Population) | 1.9% | 8.1% |
Similar Demographics by Unemployment Among Seniors over 65 years
Demographics Similar to Immigrants from Burma/Myanmar by Unemployment Among Seniors over 65 years
In terms of unemployment among seniors over 65 years, the demographic groups most similar to Immigrants from Burma/Myanmar are Lumbee (4.6%, a difference of 0.010%), Menominee (4.6%, a difference of 0.080%), Creek (4.6%, a difference of 0.11%), Immigrants from Eritrea (4.7%, a difference of 0.40%), and Cuban (4.6%, a difference of 0.52%).
| Demographics | Rating | Rank | Unemployment Among Seniors over 65 years |
| Indonesians | 100.0 /100 | #9 | Exceptional 4.5% |
| Immigrants | Zaire | 100.0 /100 | #10 | Exceptional 4.5% |
| Comanche | 100.0 /100 | #11 | Exceptional 4.6% |
| Osage | 100.0 /100 | #12 | Exceptional 4.6% |
| Cubans | 100.0 /100 | #13 | Exceptional 4.6% |
| Menominee | 100.0 /100 | #14 | Exceptional 4.6% |
| Lumbee | 100.0 /100 | #15 | Exceptional 4.6% |
| Immigrants | Burma/Myanmar | 100.0 /100 | #16 | Exceptional 4.6% |
| Creek | 100.0 /100 | #17 | Exceptional 4.6% |
| Immigrants | Eritrea | 100.0 /100 | #18 | Exceptional 4.7% |
| Lebanese | 100.0 /100 | #19 | Exceptional 4.7% |
| Immigrants | Nepal | 100.0 /100 | #20 | Exceptional 4.7% |
| Norwegians | 100.0 /100 | #21 | Exceptional 4.7% |
| Czechs | 100.0 /100 | #22 | Exceptional 4.7% |
| Kenyans | 100.0 /100 | #23 | Exceptional 4.7% |
Demographics Similar to Lithuanians by Unemployment Among Seniors over 65 years
In terms of unemployment among seniors over 65 years, the demographic groups most similar to Lithuanians are Mongolian (5.1%, a difference of 0.050%), Immigrants from Western Europe (5.1%, a difference of 0.070%), Immigrants from Eastern Asia (5.1%, a difference of 0.11%), Nonimmigrants (5.1%, a difference of 0.13%), and Immigrants from Ireland (5.1%, a difference of 0.16%).
| Demographics | Rating | Rank | Unemployment Among Seniors over 65 years |
| Immigrants | South Eastern Asia | 65.6 /100 | #162 | Good 5.1% |
| Potawatomi | 64.5 /100 | #163 | Good 5.1% |
| Nepalese | 64.5 /100 | #164 | Good 5.1% |
| Immigrants | Ukraine | 64.2 /100 | #165 | Good 5.1% |
| Immigrants | Laos | 63.8 /100 | #166 | Good 5.1% |
| Immigrants | Western Europe | 60.4 /100 | #167 | Good 5.1% |
| Mongolians | 59.8 /100 | #168 | Average 5.1% |
| Lithuanians | 58.2 /100 | #169 | Average 5.1% |
| Immigrants | Eastern Asia | 54.9 /100 | #170 | Average 5.1% |
| Immigrants | Nonimmigrants | 54.1 /100 | #171 | Average 5.1% |
| Immigrants | Ireland | 53.2 /100 | #172 | Average 5.1% |
| Immigrants | Spain | 51.7 /100 | #173 | Average 5.1% |
| Spanish Americans | 50.0 /100 | #174 | Average 5.1% |
| Immigrants | Eastern Europe | 49.8 /100 | #175 | Average 5.1% |
| Indians (Asian) | 46.6 /100 | #176 | Average 5.2% |