Assyrian/Chaldean/Syriac vs Zimbabwean Unemployment Among Seniors over 65 years
COMPARE
Assyrian/Chaldean/Syriac
Zimbabwean
Unemployment Among Seniors over 65 years
Unemployment Among Seniors over 65 years Comparison
Assyrians/Chaldeans/Syriacs
Zimbabweans
5.0%
UNEMPLOYMENT AMONG SENIORS OVER 65 YEARS
96.8/ 100
METRIC RATING
95th/ 347
METRIC RANK
5.6%
UNEMPLOYMENT AMONG SENIORS OVER 65 YEARS
0.0/ 100
METRIC RATING
300th/ 347
METRIC RANK
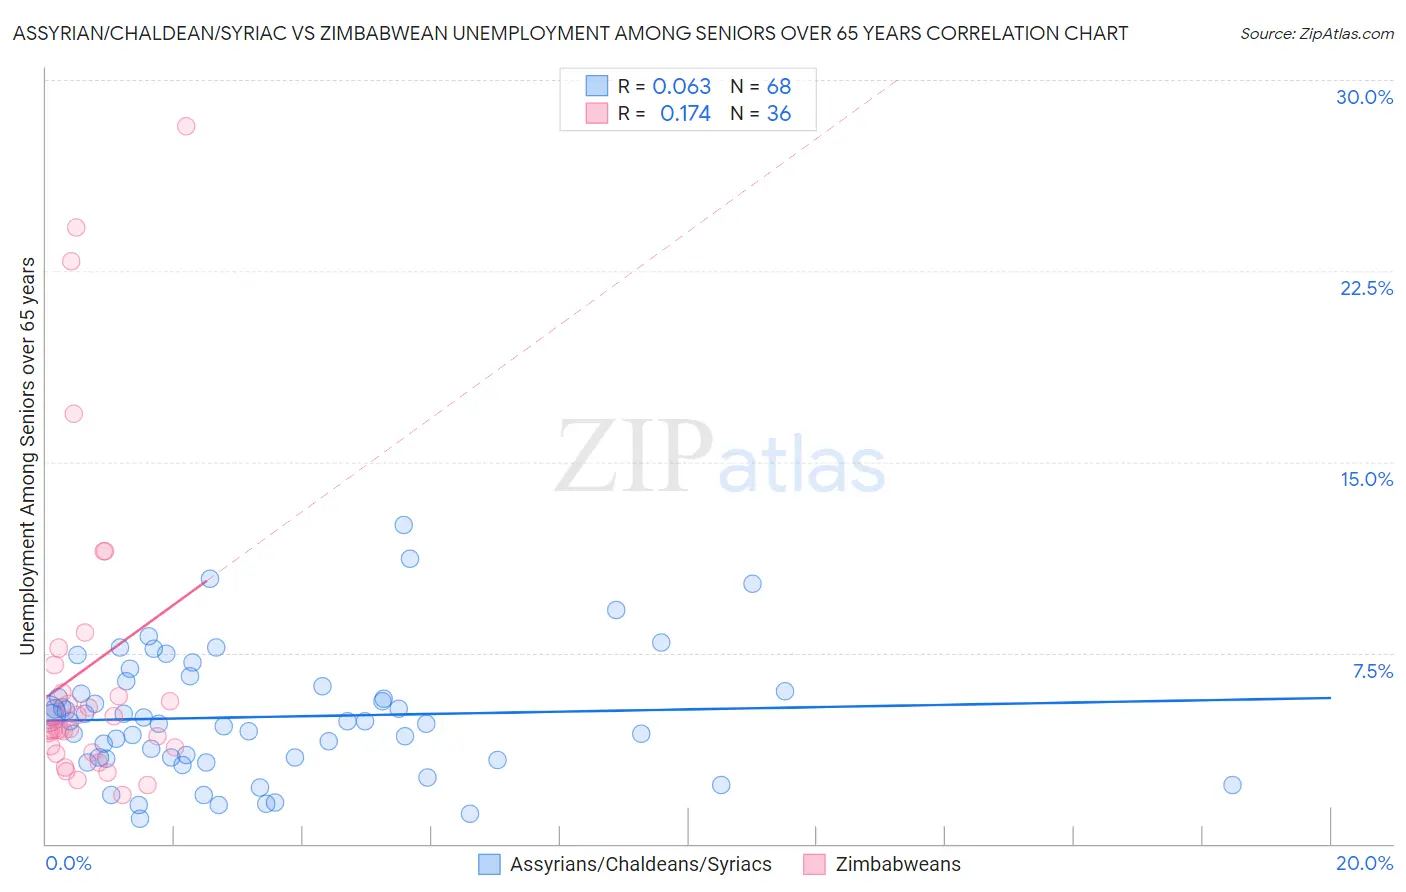
Assyrian/Chaldean/Syriac vs Zimbabwean Unemployment Among Seniors over 65 years Correlation Chart
The statistical analysis conducted on geographies consisting of 107,075,220 people shows a slight positive correlation between the proportion of Assyrians/Chaldeans/Syriacs and unemployment rate amomg seniors over the age of 65 in the United States with a correlation coefficient (R) of 0.063 and weighted average of 5.0%. Similarly, the statistical analysis conducted on geographies consisting of 67,931,218 people shows a poor positive correlation between the proportion of Zimbabweans and unemployment rate amomg seniors over the age of 65 in the United States with a correlation coefficient (R) of 0.174 and weighted average of 5.6%, a difference of 11.1%.
Unemployment Among Seniors over 65 years Correlation Summary
| Measurement | Assyrian/Chaldean/Syriac | Zimbabwean |
| Minimum | 1.0% | 1.9% |
| Maximum | 12.5% | 28.2% |
| Range | 11.5% | 26.3% |
| Mean | 5.0% | 7.0% |
| Median | 4.8% | 4.5% |
| Interquartile 25% (IQ1) | 3.4% | 3.7% |
| Interquartile 75% (IQ3) | 6.1% | 6.5% |
| Interquartile Range (IQR) | 2.7% | 2.8% |
| Standard Deviation (Sample) | 2.4% | 6.3% |
| Standard Deviation (Population) | 2.4% | 6.2% |
Similar Demographics by Unemployment Among Seniors over 65 years
Demographics Similar to Assyrians/Chaldeans/Syriacs by Unemployment Among Seniors over 65 years
In terms of unemployment among seniors over 65 years, the demographic groups most similar to Assyrians/Chaldeans/Syriacs are Immigrants from Singapore (5.0%, a difference of 0.0%), Burmese (5.0%, a difference of 0.010%), Immigrants from Oceania (5.0%, a difference of 0.010%), Czechoslovakian (5.0%, a difference of 0.010%), and South African (5.0%, a difference of 0.070%).
| Demographics | Rating | Rank | Unemployment Among Seniors over 65 years |
| Afghans | 97.6 /100 | #88 | Exceptional 5.0% |
| Immigrants | South Central Asia | 97.6 /100 | #89 | Exceptional 5.0% |
| Immigrants | South Africa | 97.6 /100 | #90 | Exceptional 5.0% |
| Immigrants | Bolivia | 97.3 /100 | #91 | Exceptional 5.0% |
| Immigrants | Bulgaria | 97.3 /100 | #92 | Exceptional 5.0% |
| Austrians | 97.3 /100 | #93 | Exceptional 5.0% |
| Burmese | 96.8 /100 | #94 | Exceptional 5.0% |
| Assyrians/Chaldeans/Syriacs | 96.8 /100 | #95 | Exceptional 5.0% |
| Immigrants | Singapore | 96.8 /100 | #96 | Exceptional 5.0% |
| Immigrants | Oceania | 96.8 /100 | #97 | Exceptional 5.0% |
| Czechoslovakians | 96.7 /100 | #98 | Exceptional 5.0% |
| South Africans | 96.5 /100 | #99 | Exceptional 5.0% |
| Romanians | 95.5 /100 | #100 | Exceptional 5.0% |
| Yugoslavians | 95.4 /100 | #101 | Exceptional 5.0% |
| Immigrants | Thailand | 95.4 /100 | #102 | Exceptional 5.0% |
Demographics Similar to Zimbabweans by Unemployment Among Seniors over 65 years
In terms of unemployment among seniors over 65 years, the demographic groups most similar to Zimbabweans are Guyanese (5.6%, a difference of 0.050%), Immigrants from West Indies (5.6%, a difference of 0.14%), Hispanic or Latino (5.6%, a difference of 0.20%), Yaqui (5.5%, a difference of 0.26%), and Cape Verdean (5.5%, a difference of 0.27%).
| Demographics | Rating | Rank | Unemployment Among Seniors over 65 years |
| Immigrants | Venezuela | 0.0 /100 | #293 | Tragic 5.5% |
| Armenians | 0.0 /100 | #294 | Tragic 5.5% |
| Cheyenne | 0.0 /100 | #295 | Tragic 5.5% |
| Cape Verdeans | 0.0 /100 | #296 | Tragic 5.5% |
| Yaqui | 0.0 /100 | #297 | Tragic 5.5% |
| Immigrants | West Indies | 0.0 /100 | #298 | Tragic 5.6% |
| Guyanese | 0.0 /100 | #299 | Tragic 5.6% |
| Zimbabweans | 0.0 /100 | #300 | Tragic 5.6% |
| Hispanics or Latinos | 0.0 /100 | #301 | Tragic 5.6% |
| Guatemalans | 0.0 /100 | #302 | Tragic 5.6% |
| Immigrants | Latin America | 0.0 /100 | #303 | Tragic 5.6% |
| Liberians | 0.0 /100 | #304 | Tragic 5.6% |
| Mexicans | 0.0 /100 | #305 | Tragic 5.6% |
| Ecuadorians | 0.0 /100 | #306 | Tragic 5.6% |
| Portuguese | 0.0 /100 | #307 | Tragic 5.6% |