Assyrian/Chaldean/Syriac vs Sudanese Unemployment Among Seniors over 65 years
COMPARE
Assyrian/Chaldean/Syriac
Sudanese
Unemployment Among Seniors over 65 years
Unemployment Among Seniors over 65 years Comparison
Assyrians/Chaldeans/Syriacs
Sudanese
5.0%
UNEMPLOYMENT AMONG SENIORS OVER 65 YEARS
96.8/ 100
METRIC RATING
95th/ 347
METRIC RANK
4.4%
UNEMPLOYMENT AMONG SENIORS OVER 65 YEARS
100.0/ 100
METRIC RATING
4th/ 347
METRIC RANK
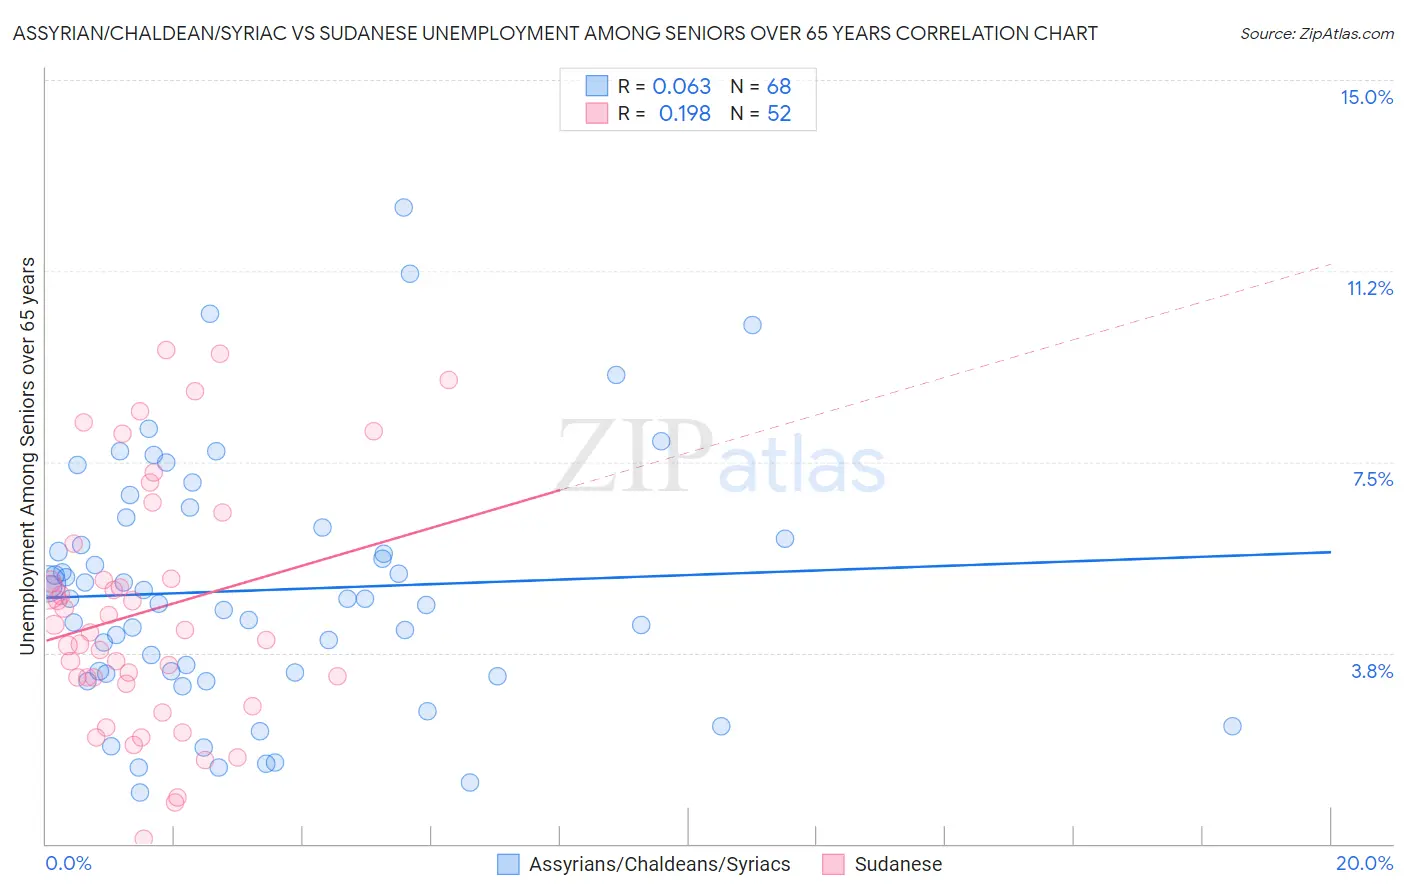
Assyrian/Chaldean/Syriac vs Sudanese Unemployment Among Seniors over 65 years Correlation Chart
The statistical analysis conducted on geographies consisting of 107,075,220 people shows a slight positive correlation between the proportion of Assyrians/Chaldeans/Syriacs and unemployment rate amomg seniors over the age of 65 in the United States with a correlation coefficient (R) of 0.063 and weighted average of 5.0%. Similarly, the statistical analysis conducted on geographies consisting of 105,958,134 people shows a poor positive correlation between the proportion of Sudanese and unemployment rate amomg seniors over the age of 65 in the United States with a correlation coefficient (R) of 0.198 and weighted average of 4.4%, a difference of 13.7%.
Unemployment Among Seniors over 65 years Correlation Summary
| Measurement | Assyrian/Chaldean/Syriac | Sudanese |
| Minimum | 1.0% | 0.10% |
| Maximum | 12.5% | 9.7% |
| Range | 11.5% | 9.6% |
| Mean | 5.0% | 4.6% |
| Median | 4.8% | 4.2% |
| Interquartile 25% (IQ1) | 3.4% | 3.2% |
| Interquartile 75% (IQ3) | 6.1% | 5.5% |
| Interquartile Range (IQR) | 2.7% | 2.3% |
| Standard Deviation (Sample) | 2.4% | 2.4% |
| Standard Deviation (Population) | 2.4% | 2.4% |
Similar Demographics by Unemployment Among Seniors over 65 years
Demographics Similar to Assyrians/Chaldeans/Syriacs by Unemployment Among Seniors over 65 years
In terms of unemployment among seniors over 65 years, the demographic groups most similar to Assyrians/Chaldeans/Syriacs are Immigrants from Singapore (5.0%, a difference of 0.0%), Burmese (5.0%, a difference of 0.010%), Immigrants from Oceania (5.0%, a difference of 0.010%), Czechoslovakian (5.0%, a difference of 0.010%), and South African (5.0%, a difference of 0.070%).
| Demographics | Rating | Rank | Unemployment Among Seniors over 65 years |
| Afghans | 97.6 /100 | #88 | Exceptional 5.0% |
| Immigrants | South Central Asia | 97.6 /100 | #89 | Exceptional 5.0% |
| Immigrants | South Africa | 97.6 /100 | #90 | Exceptional 5.0% |
| Immigrants | Bolivia | 97.3 /100 | #91 | Exceptional 5.0% |
| Immigrants | Bulgaria | 97.3 /100 | #92 | Exceptional 5.0% |
| Austrians | 97.3 /100 | #93 | Exceptional 5.0% |
| Burmese | 96.8 /100 | #94 | Exceptional 5.0% |
| Assyrians/Chaldeans/Syriacs | 96.8 /100 | #95 | Exceptional 5.0% |
| Immigrants | Singapore | 96.8 /100 | #96 | Exceptional 5.0% |
| Immigrants | Oceania | 96.8 /100 | #97 | Exceptional 5.0% |
| Czechoslovakians | 96.7 /100 | #98 | Exceptional 5.0% |
| South Africans | 96.5 /100 | #99 | Exceptional 5.0% |
| Romanians | 95.5 /100 | #100 | Exceptional 5.0% |
| Yugoslavians | 95.4 /100 | #101 | Exceptional 5.0% |
| Immigrants | Thailand | 95.4 /100 | #102 | Exceptional 5.0% |
Demographics Similar to Sudanese by Unemployment Among Seniors over 65 years
In terms of unemployment among seniors over 65 years, the demographic groups most similar to Sudanese are Chickasaw (4.4%, a difference of 0.080%), Immigrants from Cuba (4.5%, a difference of 1.3%), Immigrants from Congo (4.5%, a difference of 2.1%), Tsimshian (4.5%, a difference of 2.7%), and Indonesian (4.5%, a difference of 3.2%).
| Demographics | Rating | Rank | Unemployment Among Seniors over 65 years |
| Chinese | 100.0 /100 | #1 | Exceptional 4.2% |
| Hmong | 100.0 /100 | #2 | Exceptional 4.2% |
| Fijians | 100.0 /100 | #3 | Exceptional 4.2% |
| Sudanese | 100.0 /100 | #4 | Exceptional 4.4% |
| Chickasaw | 100.0 /100 | #5 | Exceptional 4.4% |
| Immigrants | Cuba | 100.0 /100 | #6 | Exceptional 4.5% |
| Immigrants | Congo | 100.0 /100 | #7 | Exceptional 4.5% |
| Tsimshian | 100.0 /100 | #8 | Exceptional 4.5% |
| Indonesians | 100.0 /100 | #9 | Exceptional 4.5% |
| Immigrants | Zaire | 100.0 /100 | #10 | Exceptional 4.5% |
| Comanche | 100.0 /100 | #11 | Exceptional 4.6% |
| Osage | 100.0 /100 | #12 | Exceptional 4.6% |
| Cubans | 100.0 /100 | #13 | Exceptional 4.6% |
| Menominee | 100.0 /100 | #14 | Exceptional 4.6% |
| Lumbee | 100.0 /100 | #15 | Exceptional 4.6% |