Assyrian/Chaldean/Syriac vs Lithuanian Births to Unmarried Women
COMPARE
Assyrian/Chaldean/Syriac
Lithuanian
Births to Unmarried Women
Births to Unmarried Women Comparison
Assyrians/Chaldeans/Syriacs
Lithuanians
22.0%
BIRTHS TO UNMARRIED WOMEN
100.0/ 100
METRIC RATING
1st/ 347
METRIC RANK
29.6%
BIRTHS TO UNMARRIED WOMEN
94.4/ 100
METRIC RATING
104th/ 347
METRIC RANK
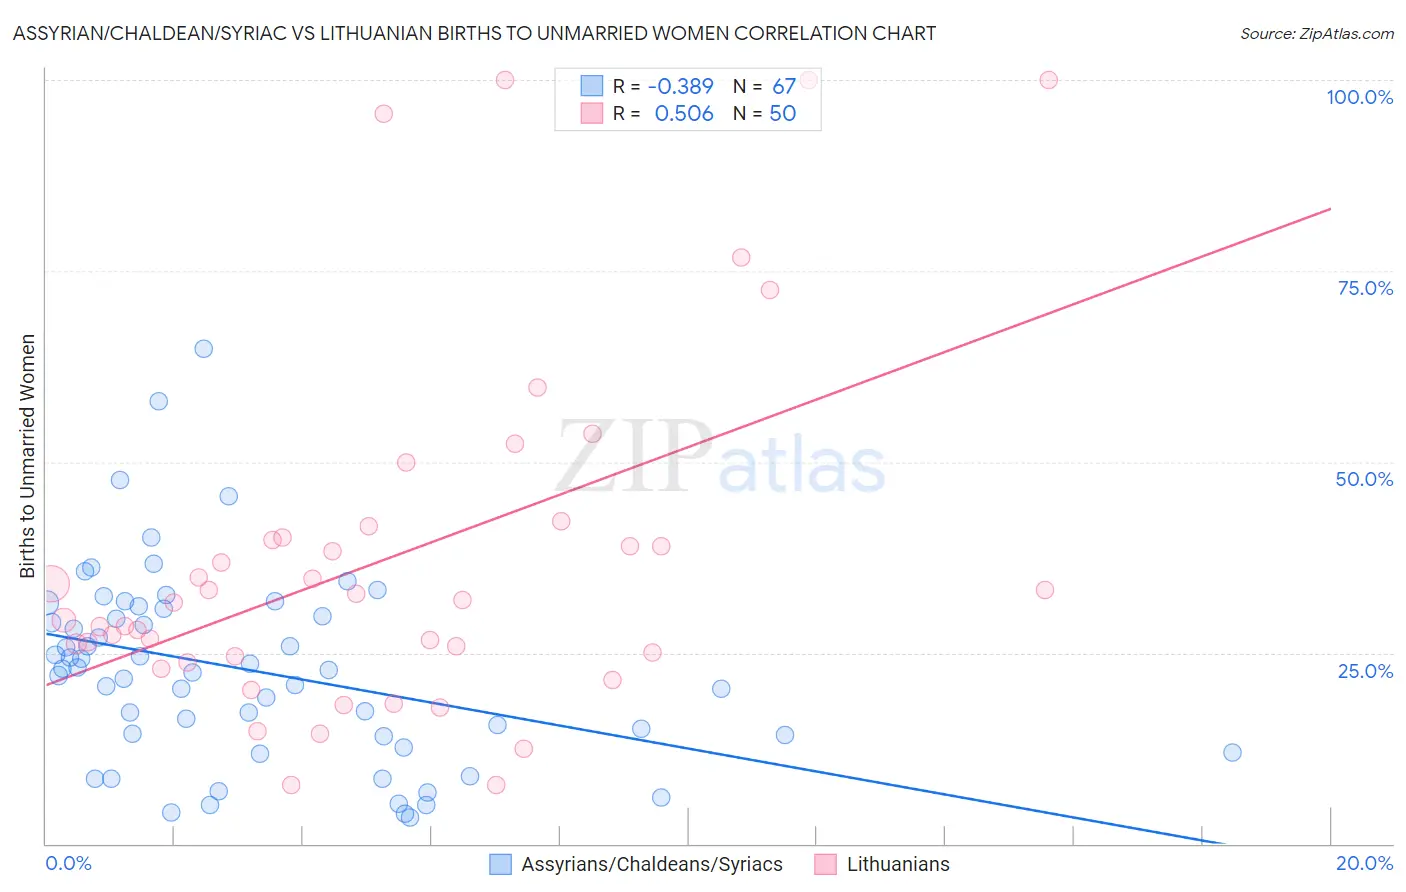
Assyrian/Chaldean/Syriac vs Lithuanian Births to Unmarried Women Correlation Chart
The statistical analysis conducted on geographies consisting of 106,724,446 people shows a mild negative correlation between the proportion of Assyrians/Chaldeans/Syriacs and percentage of births to unmarried women in the United States with a correlation coefficient (R) of -0.389 and weighted average of 22.0%. Similarly, the statistical analysis conducted on geographies consisting of 385,212,926 people shows a substantial positive correlation between the proportion of Lithuanians and percentage of births to unmarried women in the United States with a correlation coefficient (R) of 0.506 and weighted average of 29.6%, a difference of 34.5%.
Births to Unmarried Women Correlation Summary
| Measurement | Assyrian/Chaldean/Syriac | Lithuanian |
| Minimum | 3.5% | 7.7% |
| Maximum | 64.8% | 100.0% |
| Range | 61.3% | 92.3% |
| Mean | 22.7% | 37.3% |
| Median | 22.7% | 31.8% |
| Interquartile 25% (IQ1) | 14.0% | 24.6% |
| Interquartile 75% (IQ3) | 30.8% | 40.0% |
| Interquartile Range (IQR) | 16.8% | 15.4% |
| Standard Deviation (Sample) | 12.6% | 23.1% |
| Standard Deviation (Population) | 12.5% | 22.9% |
Similar Demographics by Births to Unmarried Women
Demographics Similar to Assyrians/Chaldeans/Syriacs by Births to Unmarried Women
In terms of births to unmarried women, the demographic groups most similar to Assyrians/Chaldeans/Syriacs are Immigrants from India (22.9%, a difference of 4.2%), Filipino (23.0%, a difference of 4.6%), Immigrants from Taiwan (23.0%, a difference of 4.7%), Immigrants from Hong Kong (23.6%, a difference of 7.3%), and Immigrants from Iran (24.0%, a difference of 9.0%).
| Demographics | Rating | Rank | Births to Unmarried Women |
| Assyrians/Chaldeans/Syriacs | 100.0 /100 | #1 | Exceptional 22.0% |
| Immigrants | India | 100.0 /100 | #2 | Exceptional 22.9% |
| Filipinos | 100.0 /100 | #3 | Exceptional 23.0% |
| Immigrants | Taiwan | 100.0 /100 | #4 | Exceptional 23.0% |
| Immigrants | Hong Kong | 100.0 /100 | #5 | Exceptional 23.6% |
| Immigrants | Iran | 100.0 /100 | #6 | Exceptional 24.0% |
| Thais | 100.0 /100 | #7 | Exceptional 24.0% |
| Immigrants | China | 100.0 /100 | #8 | Exceptional 24.7% |
| Immigrants | South Central Asia | 100.0 /100 | #9 | Exceptional 24.7% |
| Immigrants | Eastern Asia | 100.0 /100 | #10 | Exceptional 25.0% |
| Immigrants | Israel | 100.0 /100 | #11 | Exceptional 25.1% |
| Indians (Asian) | 100.0 /100 | #12 | Exceptional 25.3% |
| Iranians | 100.0 /100 | #13 | Exceptional 25.3% |
| Immigrants | Lebanon | 100.0 /100 | #14 | Exceptional 25.3% |
| Immigrants | Singapore | 100.0 /100 | #15 | Exceptional 25.6% |
Demographics Similar to Lithuanians by Births to Unmarried Women
In terms of births to unmarried women, the demographic groups most similar to Lithuanians are Lebanese (29.5%, a difference of 0.010%), Immigrants from Nepal (29.6%, a difference of 0.050%), Australian (29.5%, a difference of 0.060%), Immigrants from Northern Africa (29.5%, a difference of 0.14%), and Swedish (29.6%, a difference of 0.30%).
| Demographics | Rating | Rank | Births to Unmarried Women |
| Immigrants | South Africa | 95.7 /100 | #97 | Exceptional 29.3% |
| Immigrants | Syria | 95.7 /100 | #98 | Exceptional 29.4% |
| Immigrants | Denmark | 95.3 /100 | #99 | Exceptional 29.4% |
| Luxembourgers | 95.2 /100 | #100 | Exceptional 29.4% |
| Immigrants | Northern Africa | 94.7 /100 | #101 | Exceptional 29.5% |
| Australians | 94.6 /100 | #102 | Exceptional 29.5% |
| Lebanese | 94.4 /100 | #103 | Exceptional 29.5% |
| Lithuanians | 94.4 /100 | #104 | Exceptional 29.6% |
| Immigrants | Nepal | 94.3 /100 | #105 | Exceptional 29.6% |
| Swedes | 93.8 /100 | #106 | Exceptional 29.6% |
| Immigrants | Brazil | 93.7 /100 | #107 | Exceptional 29.6% |
| Paraguayans | 93.5 /100 | #108 | Exceptional 29.7% |
| Greeks | 93.4 /100 | #109 | Exceptional 29.7% |
| Immigrants | Ethiopia | 93.4 /100 | #110 | Exceptional 29.7% |
| Immigrants | Hungary | 93.0 /100 | #111 | Exceptional 29.7% |