Zip Codes with the Highest Percentage of Population with a Degree in Literature and Languages in Irving, TX

RELATED REPORTS & OPTIONS

Literature and Languages
Population
Families and Households
Female Fertility
Female Fertility (Unmarried)
Race (Community Size)
Race (Percentage)
Ancestry (Community Size)
AfricanAmericanApacheArabArgentineanAustralianAustrianBelgianBhutaneseBlackfeetBolivianBrazilianBritishBulgarianBurmeseCanadianCentral AmericanCentral American IndianCherokeeChickasawChoctawColombianCroatianCubanCzechCzechoslovakianDanishDominicanDutchDutch West IndianEastern EuropeanEcuadorianEgyptianEnglishEthiopianEuropeanFilipinoFinnishFrenchFrench American IndianFrench CanadianGermanGreekGuamanian / ChamorroGuatemalanHaitianHonduranHungarianIndian (Asian)IndonesianIranianIrishIsraeliItalianJamaicanJapaneseJordanianKenyanKoreanLaotianLebaneseLithuanianMalaysianMexicanMexican American IndianNative HawaiianNicaraguanNigerianNorthern EuropeanNorwegianOkinawanPakistaniPalestinianPanamanianPeruvianPolishPortuguesePuerto RicanRomanianRussianSalvadoranScandinavianScotch-IrishScottishSlovakSouth AfricanSouth AmericanSpaniardSpanishSri LankanSubsaharan AfricanSudaneseSwedishSwissSyrianThaiTrinidadian and TobagonianUkrainianUruguayanVenezuelanVietnameseWelshWest Indian
Ancestry (Percentage)
AfricanAmericanApacheArabArgentineanAustralianAustrianBelgianBhutaneseBlackfeetBolivianBrazilianBritishBulgarianBurmeseCanadianCentral AmericanCentral American IndianCherokeeChickasawChoctawColombianCroatianCubanCzechCzechoslovakianDanishDominicanDutchDutch West IndianEastern EuropeanEcuadorianEgyptianEnglishEthiopianEuropeanFilipinoFinnishFrenchFrench American IndianFrench CanadianGermanGreekGuamanian / ChamorroGuatemalanHaitianHonduranHungarianIndian (Asian)IndonesianIranianIrishIsraeliItalianJamaicanJapaneseJordanianKenyanKoreanLaotianLebaneseLithuanianMalaysianMexicanMexican American IndianNative HawaiianNicaraguanNigerianNorthern EuropeanNorwegianOkinawanPakistaniPalestinianPanamanianPeruvianPolishPortuguesePuerto RicanRomanianRussianSalvadoranScandinavianScotch-IrishScottishSlovakSouth AfricanSouth AmericanSpaniardSpanishSri LankanSubsaharan AfricanSudaneseSwedishSwissSyrianThaiTrinidadian and TobagonianUkrainianUruguayanVenezuelanVietnameseWelshWest Indian
Immigrant Origin (Total)
Immigrant Origin (Percentage)
Income
Income (Families)
Income (Households)
Poverty
Poverty (Families)
Unemployment
Employment Occupations
Employment Industries
Employer Class
Commute Time
Commute Means
School Enrollment
Education by Degree Field
Occupancy
Finances
Physical Characteristics
Irving
Compare Zip Codes
Comparison Subject

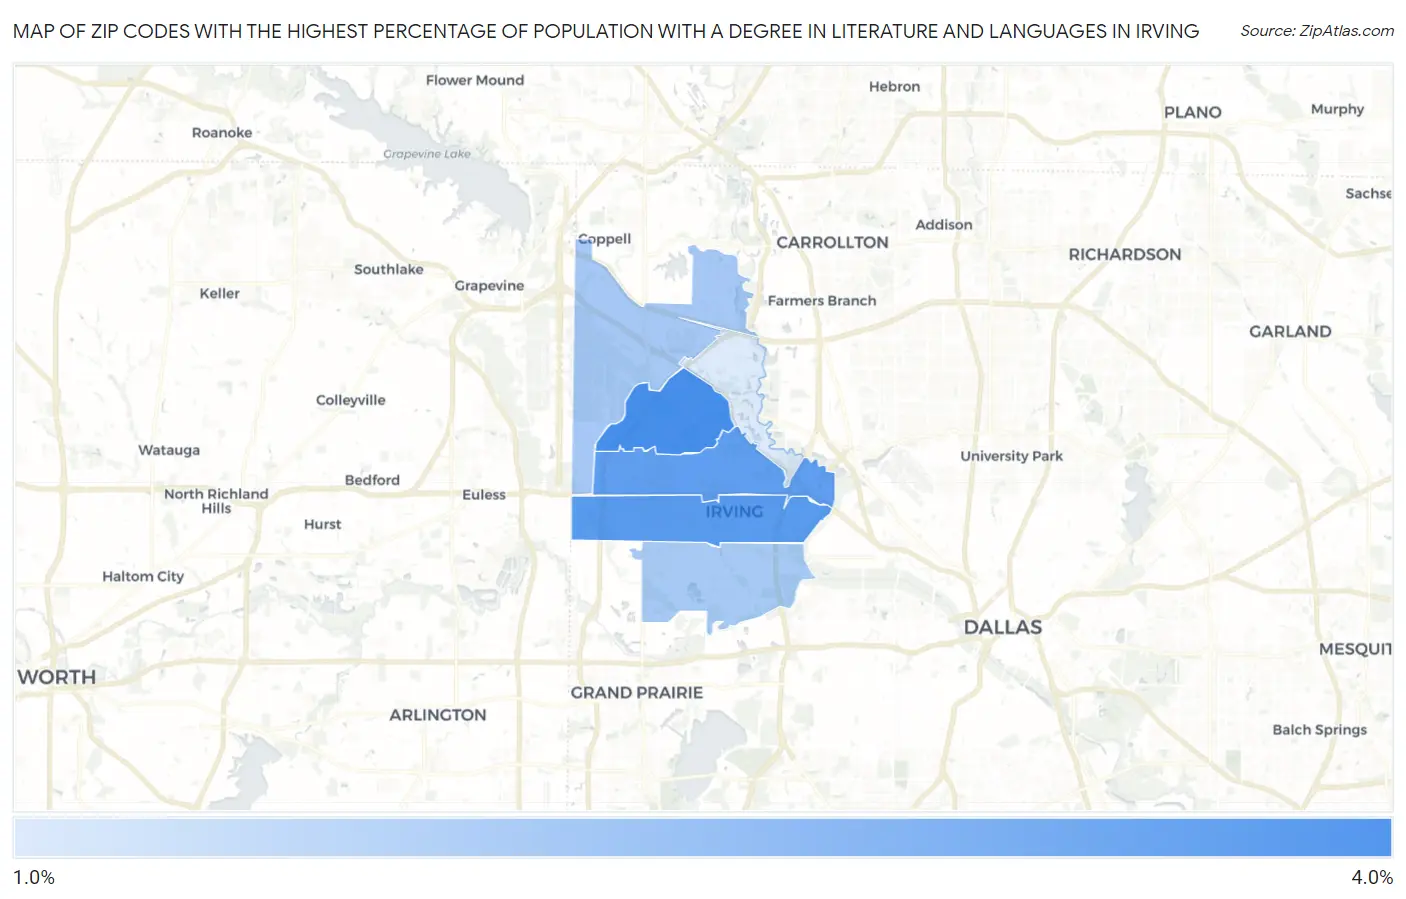
Map of Zip Codes with the Highest Percentage of Population with a Degree in Literature and Languages in Irving

0.0%
4.0%
Zip Codes with the Highest Percentage of Population with a Degree in Literature and Languages in Irving Map

Zip Codes with the Highest Percentage of Population with a Degree in Literature and Languages in Irving, TX

Zip Code % Graduates vs State vs National
1.750383.7%3.4%(+0.272)#5204.4%(-0.701)#11,126
2.750613.4%3.4%(-0.005)#5904.4%(-0.978)#12,075
3.750623.3%3.4%(-0.171)#6344.4%(-1.14)#12,662
4.750632.1%3.4%(-1.34)#9474.4%(-2.32)#16,755
5.750602.0%3.4%(-1.41)#9644.4%(-2.38)#16,978
6.750391.1%3.4%(-2.29)#1,1584.4%(-3.26)#19,740

Common Questions

What are the Top 5 Zip Codes with the Highest Percentage of Population with a Degree in Literature and Languages in Irving, TX?
Top 5 Zip Codes with the Highest Percentage of Population with a Degree in Literature and Languages in Irving, TX are:
#1
3.7%
#2
3.4%
#3
3.3%
#4
2.1%
#5
2.0%
What zip code has the Highest Percentage of Population with a Degree in Literature and Languages in Irving, TX?
75038 has the Highest Percentage of Population with a Degree in Literature and Languages in Irving, TX with 3.7%.
What is the Percentage of Population with a Degree in Literature and Languages in Irving, TX?
Percentage of Population with a Degree in Literature and Languages in Irving is 2.4%.
What is the Percentage of Population with a Degree in Literature and Languages in Texas?
Percentage of Population with a Degree in Literature and Languages in Texas is 3.4%.
What is the Percentage of Population with a Degree in Literature and Languages in the United States?
Percentage of Population with a Degree in Literature and Languages in the United States is 4.4%.