Zip Codes with the Highest Percentage of Population Carpooling to Work in Lebanon, TN
RELATED REPORTS & OPTIONS
Drive | Carpool
Lebanon
Compare Zip Codes
Map of Zip Codes with the Highest Percentage of Population Carpooling to Work in Lebanon
34.2%
34.6%
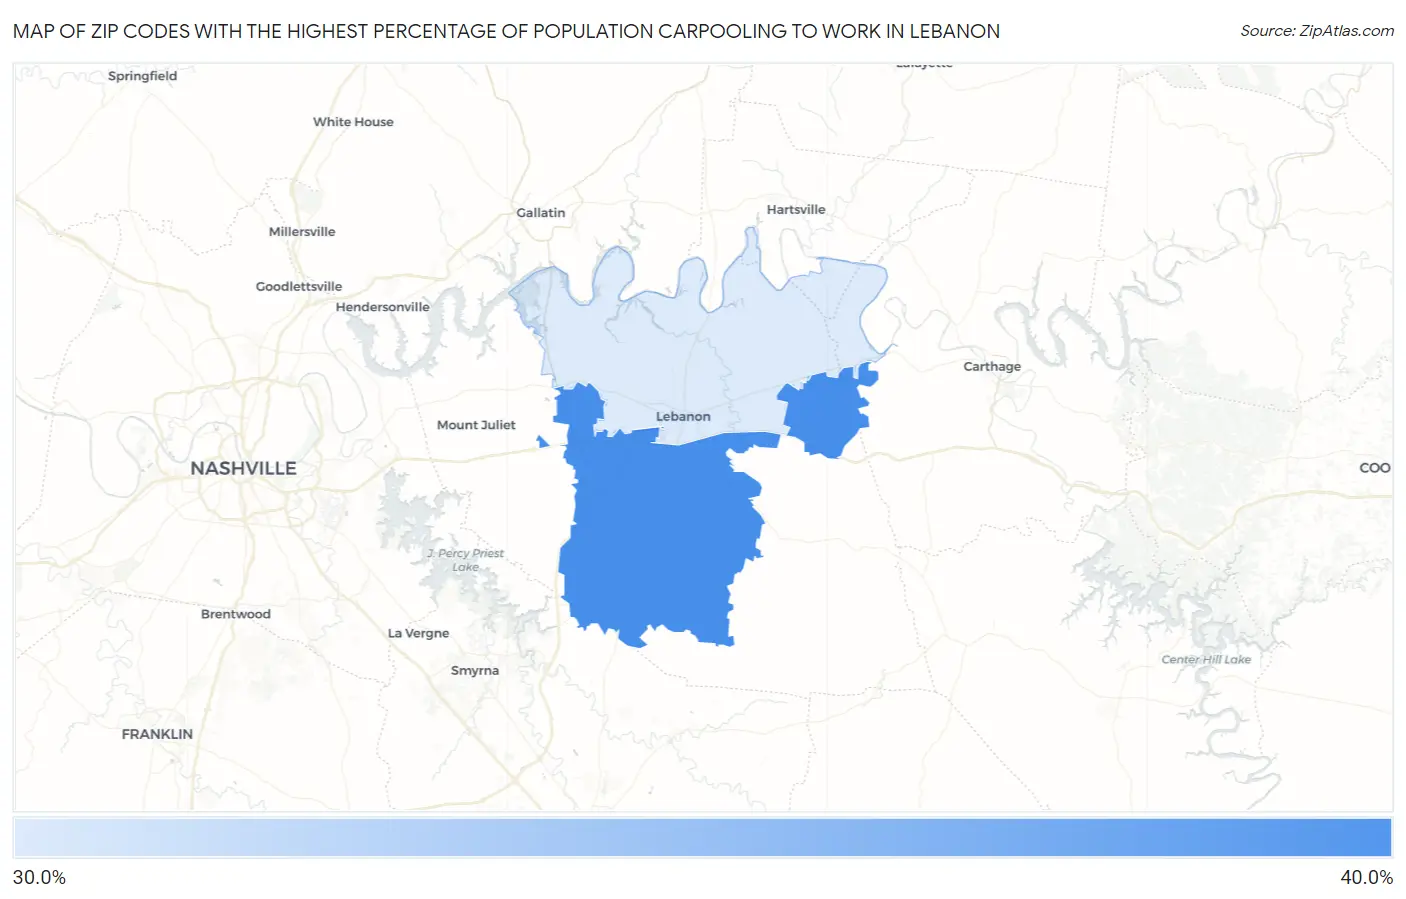
Zip Codes with the Highest Percentage of Population Carpooling to Work in Lebanon, TN
| Zip Code | % Carpool | vs State | vs National | |
| 1. | 37090 | 34.6% | 37.3%(-2.70)#384 | 38.2%(-3.60)#18,932 |
| 2. | 37087 | 34.2% | 37.3%(-3.10)#397 | 38.2%(-4.00)#19,388 |
1
Common Questions
What are the Top Zip Codes with the Highest Percentage of Population Carpooling to Work in Lebanon, TN?
Top Zip Codes with the Highest Percentage of Population Carpooling to Work in Lebanon, TN are:
What zip code has the Highest Percentage of Population Carpooling to Work in Lebanon, TN?
37090 has the Highest Percentage of Population Carpooling to Work in Lebanon, TN with 34.6%.
What is the Percentage of Population Carpooling to Work in Lebanon, TN?
Percentage of Population Carpooling to Work in Lebanon is 34.0%.
What is the Percentage of Population Carpooling to Work in Tennessee?
Percentage of Population Carpooling to Work in Tennessee is 37.3%.
What is the Percentage of Population Carpooling to Work in the United States?
Percentage of Population Carpooling to Work in the United States is 38.2%.