Zip Codes with the Highest Percentage of Population Employed in Office & Administration in Lenoir City, TN
RELATED REPORTS & OPTIONS
Office & Administration
Lenoir City
Compare Zip Codes
Map of Zip Codes with the Highest Percentage of Population Employed in Office & Administration in Lenoir City
9.2%
12.3%
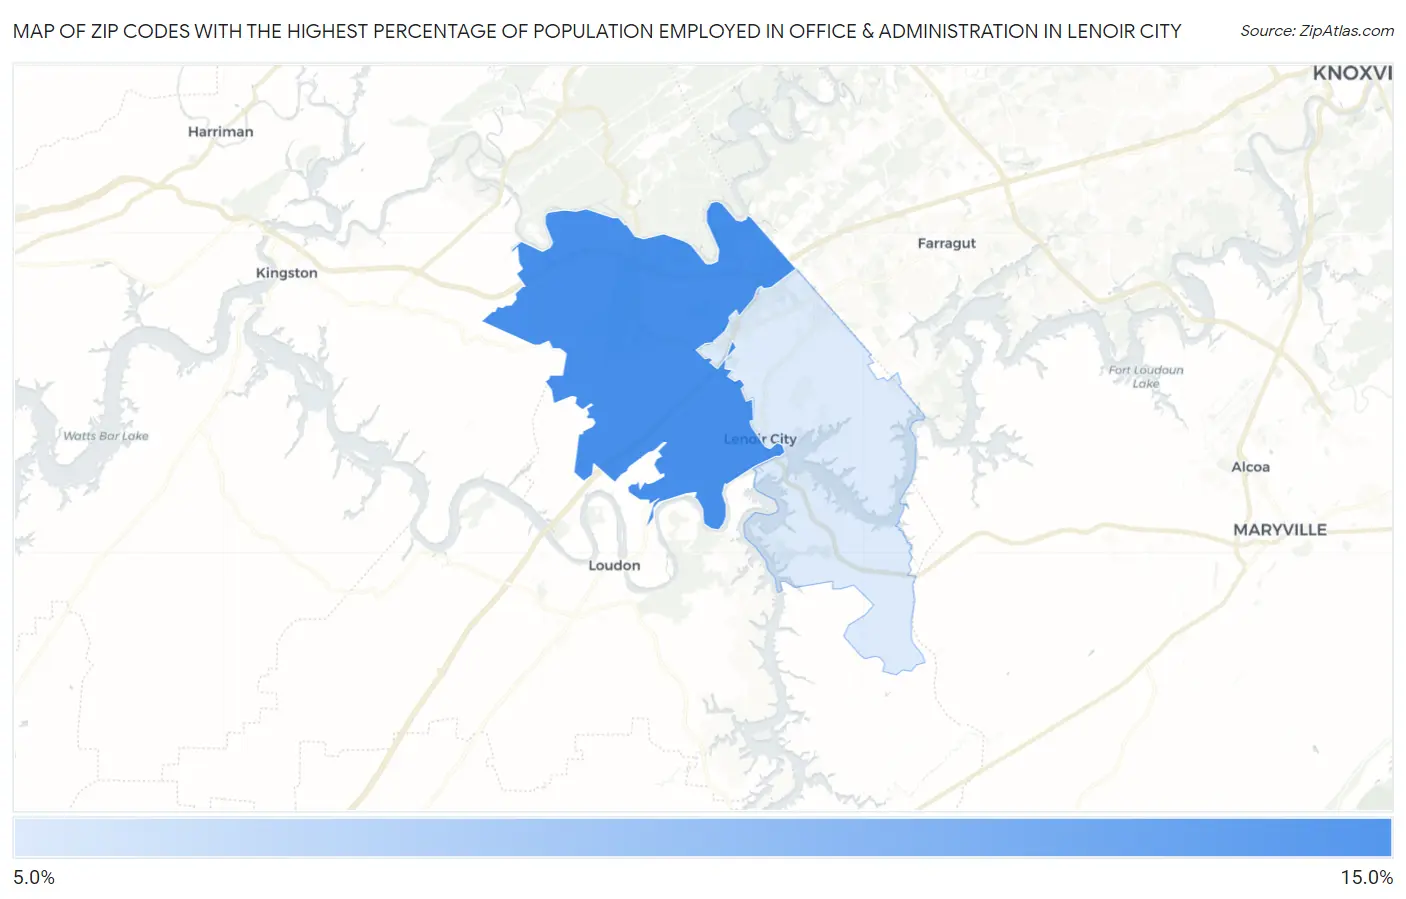
Zip Codes with the Highest Percentage of Population Employed in Office & Administration in Lenoir City, TN
| Zip Code | % Employed | vs State | vs National | |
| 1. | 37771 | 12.3% | 11.3%(+0.957)#183 | 10.9%(+1.42)#9,907 |
| 2. | 37772 | 9.2% | 11.3%(-2.09)#390 | 10.9%(-1.63)#19,603 |
1
Common Questions
What are the Top Zip Codes with the Highest Percentage of Population Employed in Office & Administration in Lenoir City, TN?
Top Zip Codes with the Highest Percentage of Population Employed in Office & Administration in Lenoir City, TN are:
What zip code has the Highest Percentage of Population Employed in Office & Administration in Lenoir City, TN?
37771 has the Highest Percentage of Population Employed in Office & Administration in Lenoir City, TN with 12.3%.
What is the Percentage of Population Employed in Office & Administration in Lenoir City, TN?
Percentage of Population Employed in Office & Administration in Lenoir City is 6.6%.
What is the Percentage of Population Employed in Office & Administration in Tennessee?
Percentage of Population Employed in Office & Administration in Tennessee is 11.3%.
What is the Percentage of Population Employed in Office & Administration in the United States?
Percentage of Population Employed in Office & Administration in the United States is 10.9%.