Zip Codes with the Highest Percentage of Population Employed in Legal Services & Support in Sevierville, TN
RELATED REPORTS & OPTIONS
Legal Services & Support
Sevierville
Compare Zip Codes
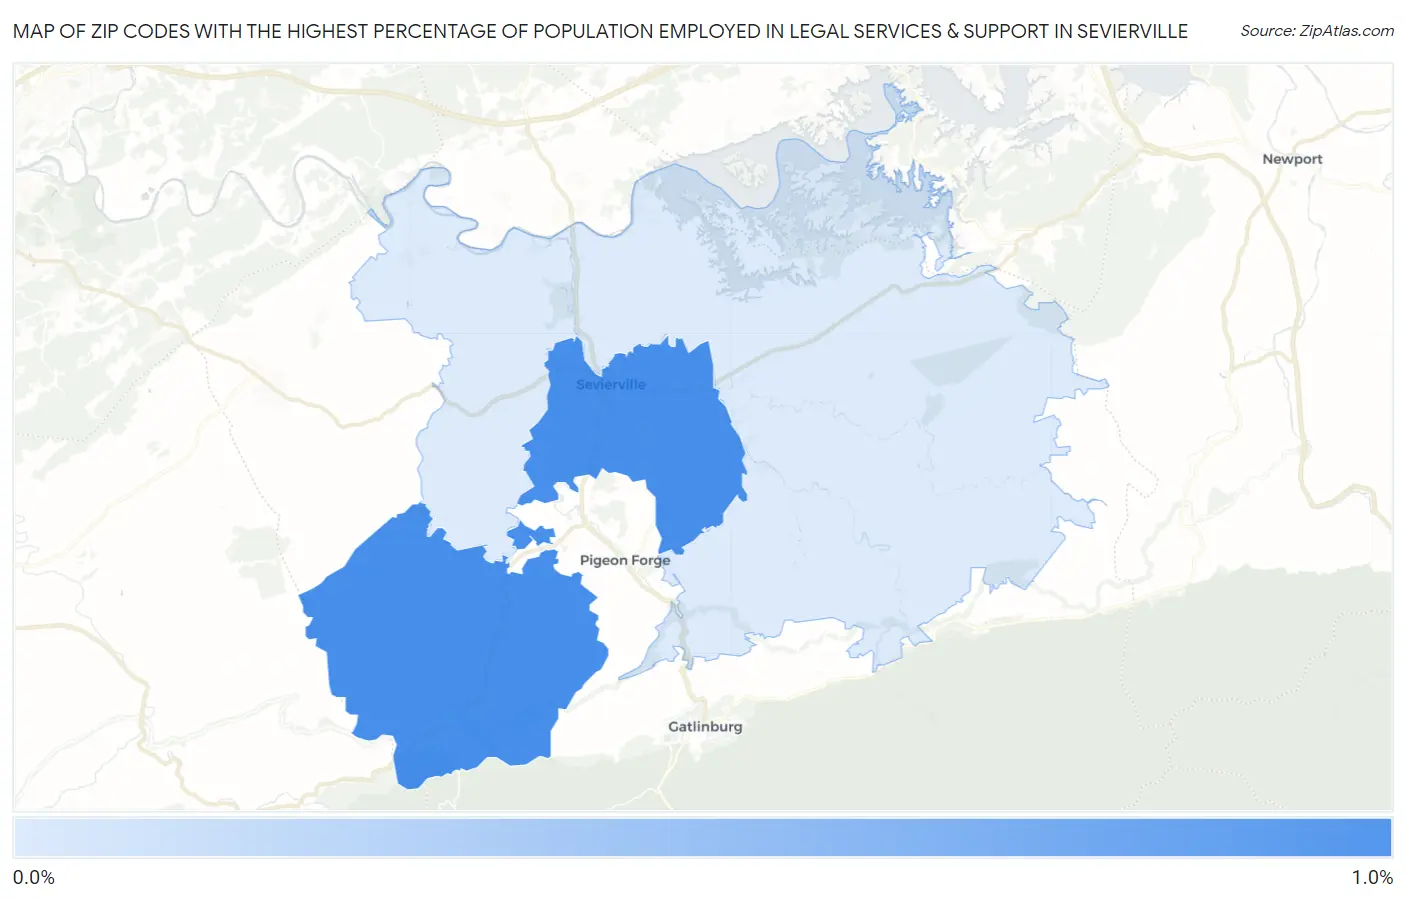
Map of Zip Codes with the Highest Percentage of Population Employed in Legal Services & Support in Sevierville
0.16%
0.89%
Zip Codes with the Highest Percentage of Population Employed in Legal Services & Support in Sevierville, TN
| Zip Code | % Employed | vs State | vs National | |
| 1. | 37862 | 0.89% | 0.90%(-0.007)#137 | 1.2%(-0.292)#8,679 |
| 2. | 37876 | 0.16% | 0.90%(-0.739)#302 | 1.2%(-1.03)#16,606 |
1
Common Questions
What are the Top Zip Codes with the Highest Percentage of Population Employed in Legal Services & Support in Sevierville, TN?
Top Zip Codes with the Highest Percentage of Population Employed in Legal Services & Support in Sevierville, TN are:
What zip code has the Highest Percentage of Population Employed in Legal Services & Support in Sevierville, TN?
37862 has the Highest Percentage of Population Employed in Legal Services & Support in Sevierville, TN with 0.89%.
What is the Percentage of Population Employed in Legal Services & Support in Sevierville, TN?
Percentage of Population Employed in Legal Services & Support in Sevierville is 0.58%.
What is the Percentage of Population Employed in Legal Services & Support in Tennessee?
Percentage of Population Employed in Legal Services & Support in Tennessee is 0.90%.
What is the Percentage of Population Employed in Legal Services & Support in the United States?
Percentage of Population Employed in Legal Services & Support in the United States is 1.2%.