Zip Codes with the Highest Percentage of Population Employed in Professional & Scientific Services in Crossville, TN
RELATED REPORTS & OPTIONS
Professional & Scientific Services
Crossville
Compare Zip Codes
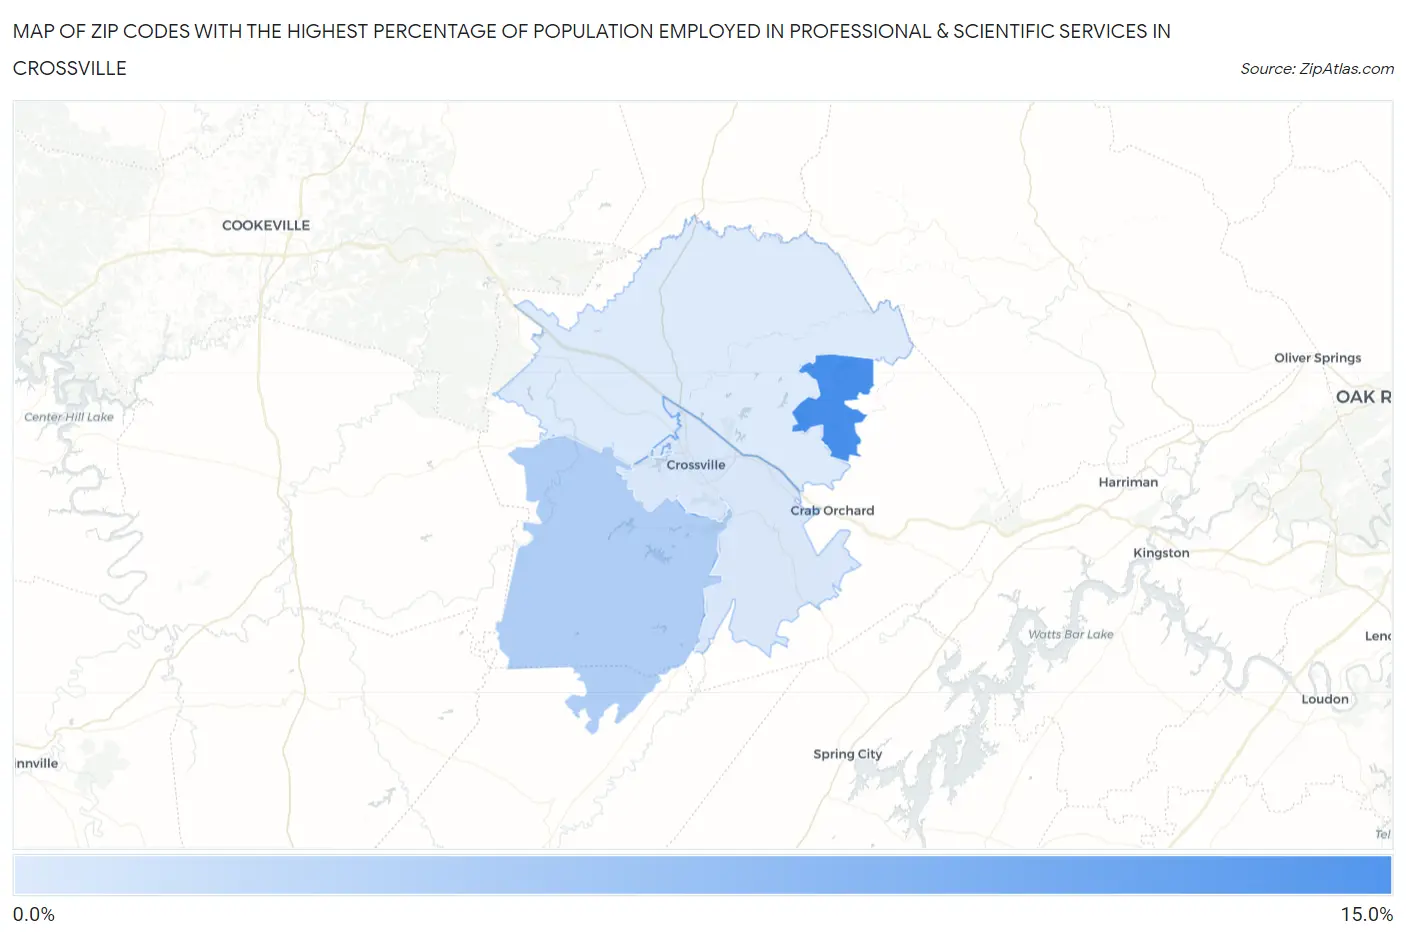
Map of Zip Codes with the Highest Percentage of Population Employed in Professional & Scientific Services in Crossville
0.0%
15.0%
Zip Codes with the Highest Percentage of Population Employed in Professional & Scientific Services in Crossville, TN
| Zip Code | % Employed | vs State | vs National | |
| 1. | 38558 | 10.7% | 5.7%(+4.93)#41 | 7.8%(+2.81)#4,066 |
| 2. | 38572 | 4.6% | 5.7%(-1.16)#210 | 7.8%(-3.28)#13,456 |
| 3. | 38555 | 2.2% | 5.7%(-3.55)#391 | 7.8%(-5.67)#21,294 |
| 4. | 38571 | 2.0% | 5.7%(-3.77)#408 | 7.8%(-5.89)#22,026 |
1
Common Questions
What are the Top 3 Zip Codes with the Highest Percentage of Population Employed in Professional & Scientific Services in Crossville, TN?
Top 3 Zip Codes with the Highest Percentage of Population Employed in Professional & Scientific Services in Crossville, TN are:
What zip code has the Highest Percentage of Population Employed in Professional & Scientific Services in Crossville, TN?
38558 has the Highest Percentage of Population Employed in Professional & Scientific Services in Crossville, TN with 10.7%.
What is the Percentage of Population Employed in Professional & Scientific Services in Crossville, TN?
Percentage of Population Employed in Professional & Scientific Services in Crossville is 2.1%.
What is the Percentage of Population Employed in Professional & Scientific Services in Tennessee?
Percentage of Population Employed in Professional & Scientific Services in Tennessee is 5.7%.
What is the Percentage of Population Employed in Professional & Scientific Services in the United States?
Percentage of Population Employed in Professional & Scientific Services in the United States is 7.8%.