Zip Codes with the Highest Percentage of Population Employed in Information in Crossville, TN
RELATED REPORTS & OPTIONS
Information & Technology
Crossville
Compare Zip Codes
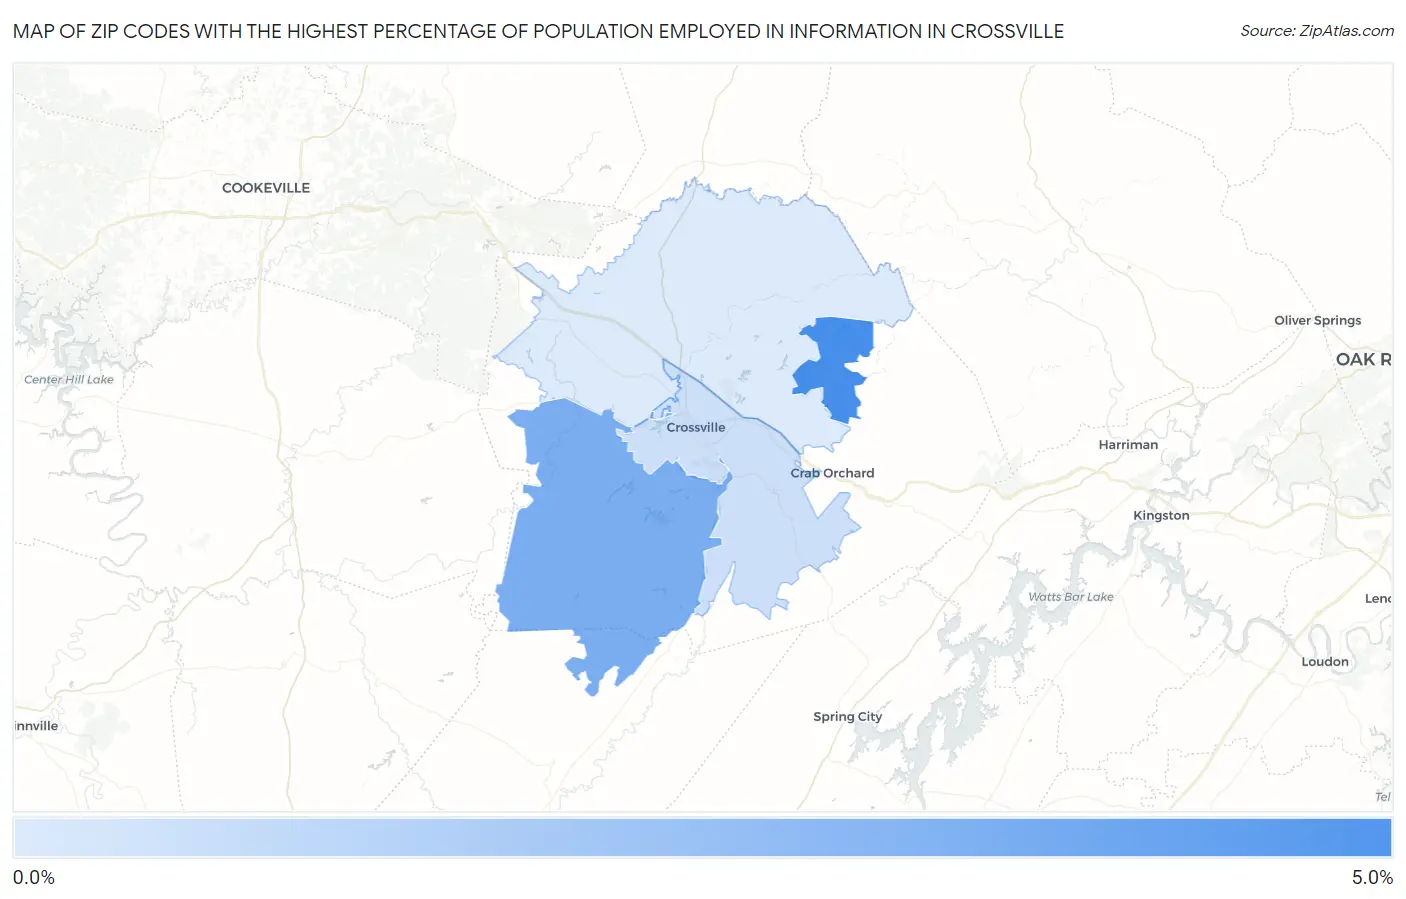
Map of Zip Codes with the Highest Percentage of Population Employed in Information in Crossville
0.0%
5.0%
Zip Codes with the Highest Percentage of Population Employed in Information in Crossville, TN
| Zip Code | % Employed | vs State | vs National | |
| 1. | 38558 | 4.1% | 1.6%(+2.50)#27 | 1.9%(+2.17)#1,916 |
| 2. | 38572 | 3.0% | 1.6%(+1.43)#53 | 1.9%(+1.10)#3,546 |
| 3. | 38555 | 1.3% | 1.6%(-0.275)#190 | 1.9%(-0.608)#12,084 |
| 4. | 38571 | 0.97% | 1.6%(-0.594)#253 | 1.9%(-0.927)#14,933 |
1
Common Questions
What are the Top 3 Zip Codes with the Highest Percentage of Population Employed in Information in Crossville, TN?
Top 3 Zip Codes with the Highest Percentage of Population Employed in Information in Crossville, TN are:
What zip code has the Highest Percentage of Population Employed in Information in Crossville, TN?
38558 has the Highest Percentage of Population Employed in Information in Crossville, TN with 4.1%.
What is the Percentage of Population Employed in Information in Crossville, TN?
Percentage of Population Employed in Information in Crossville is 2.7%.
What is the Percentage of Population Employed in Information in Tennessee?
Percentage of Population Employed in Information in Tennessee is 1.6%.
What is the Percentage of Population Employed in Information in the United States?
Percentage of Population Employed in Information in the United States is 1.9%.