Zip Codes with the Highest Percentage of Population Employed in Health Care & Social Assistance in Crossville, TN
RELATED REPORTS & OPTIONS
Health Care & Social Assistance
Crossville
Compare Zip Codes
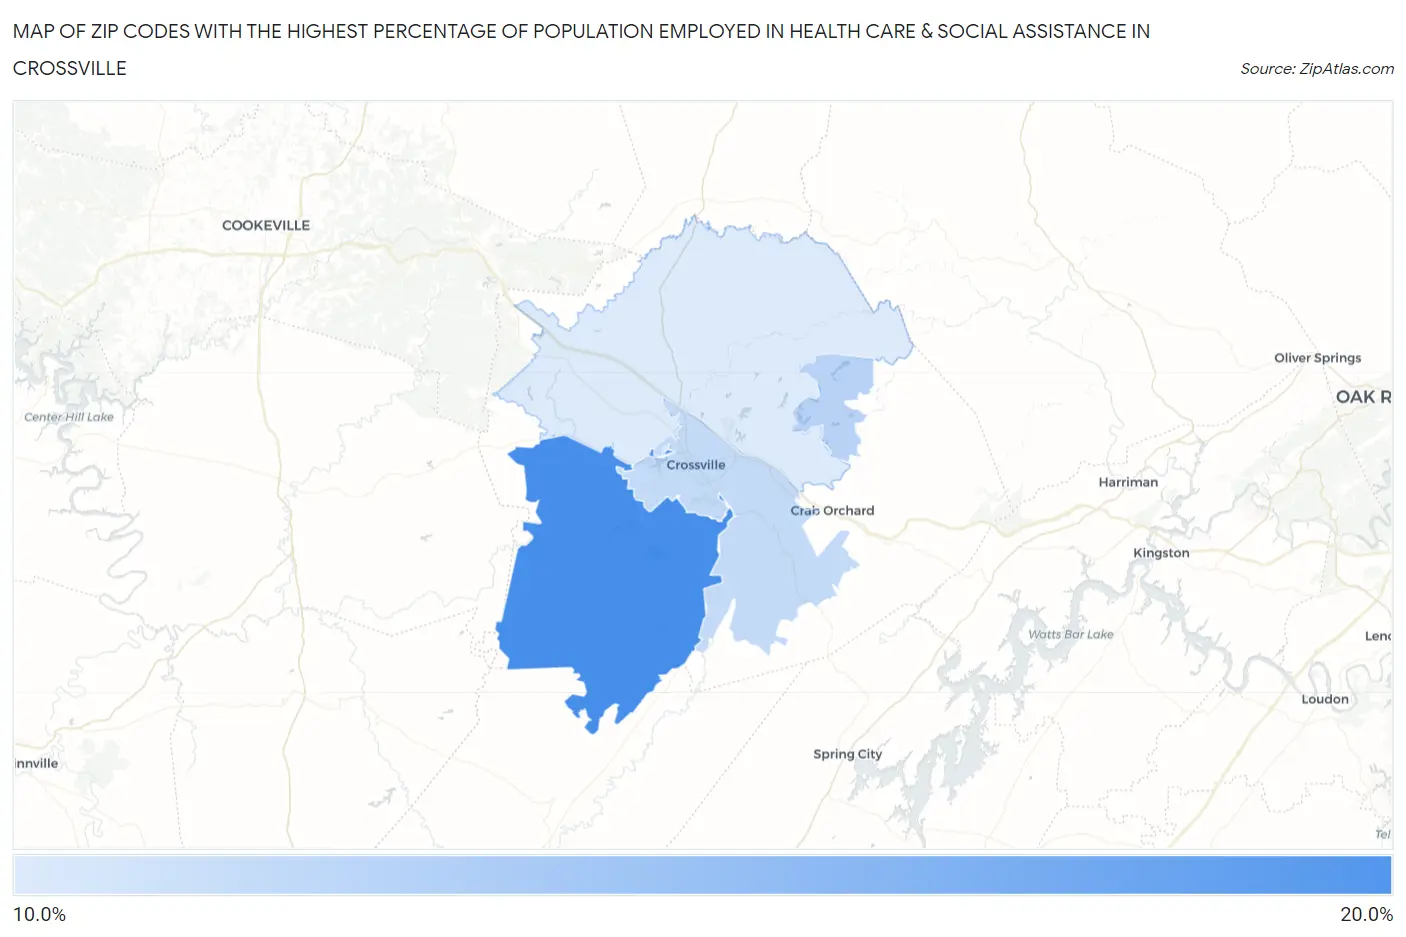
Map of Zip Codes with the Highest Percentage of Population Employed in Health Care & Social Assistance in Crossville
0.0%
20.0%
Zip Codes with the Highest Percentage of Population Employed in Health Care & Social Assistance in Crossville, TN
| Zip Code | % Employed | vs State | vs National | |
| 1. | 38572 | 16.6% | 14.0%(+2.59)#122 | 13.9%(+2.63)#8,429 |
| 2. | 38558 | 13.1% | 14.0%(-0.929)#301 | 13.9%(-0.881)#16,457 |
| 3. | 38555 | 12.7% | 14.0%(-1.28)#319 | 13.9%(-1.23)#17,333 |
| 4. | 38571 | 11.9% | 14.0%(-2.08)#367 | 13.9%(-2.03)#19,238 |
1
Common Questions
What are the Top 3 Zip Codes with the Highest Percentage of Population Employed in Health Care & Social Assistance in Crossville, TN?
Top 3 Zip Codes with the Highest Percentage of Population Employed in Health Care & Social Assistance in Crossville, TN are:
What zip code has the Highest Percentage of Population Employed in Health Care & Social Assistance in Crossville, TN?
38572 has the Highest Percentage of Population Employed in Health Care & Social Assistance in Crossville, TN with 16.6%.
What is the Percentage of Population Employed in Health Care & Social Assistance in Crossville, TN?
Percentage of Population Employed in Health Care & Social Assistance in Crossville is 10.6%.
What is the Percentage of Population Employed in Health Care & Social Assistance in Tennessee?
Percentage of Population Employed in Health Care & Social Assistance in Tennessee is 14.0%.
What is the Percentage of Population Employed in Health Care & Social Assistance in the United States?
Percentage of Population Employed in Health Care & Social Assistance in the United States is 13.9%.