Zip Codes with the Highest Percentage of Population Employed in Installation, Maintenance & Repair in Jackson, TN
RELATED REPORTS & OPTIONS
Installation, Maintenance & Repair
Jackson
Compare Zip Codes
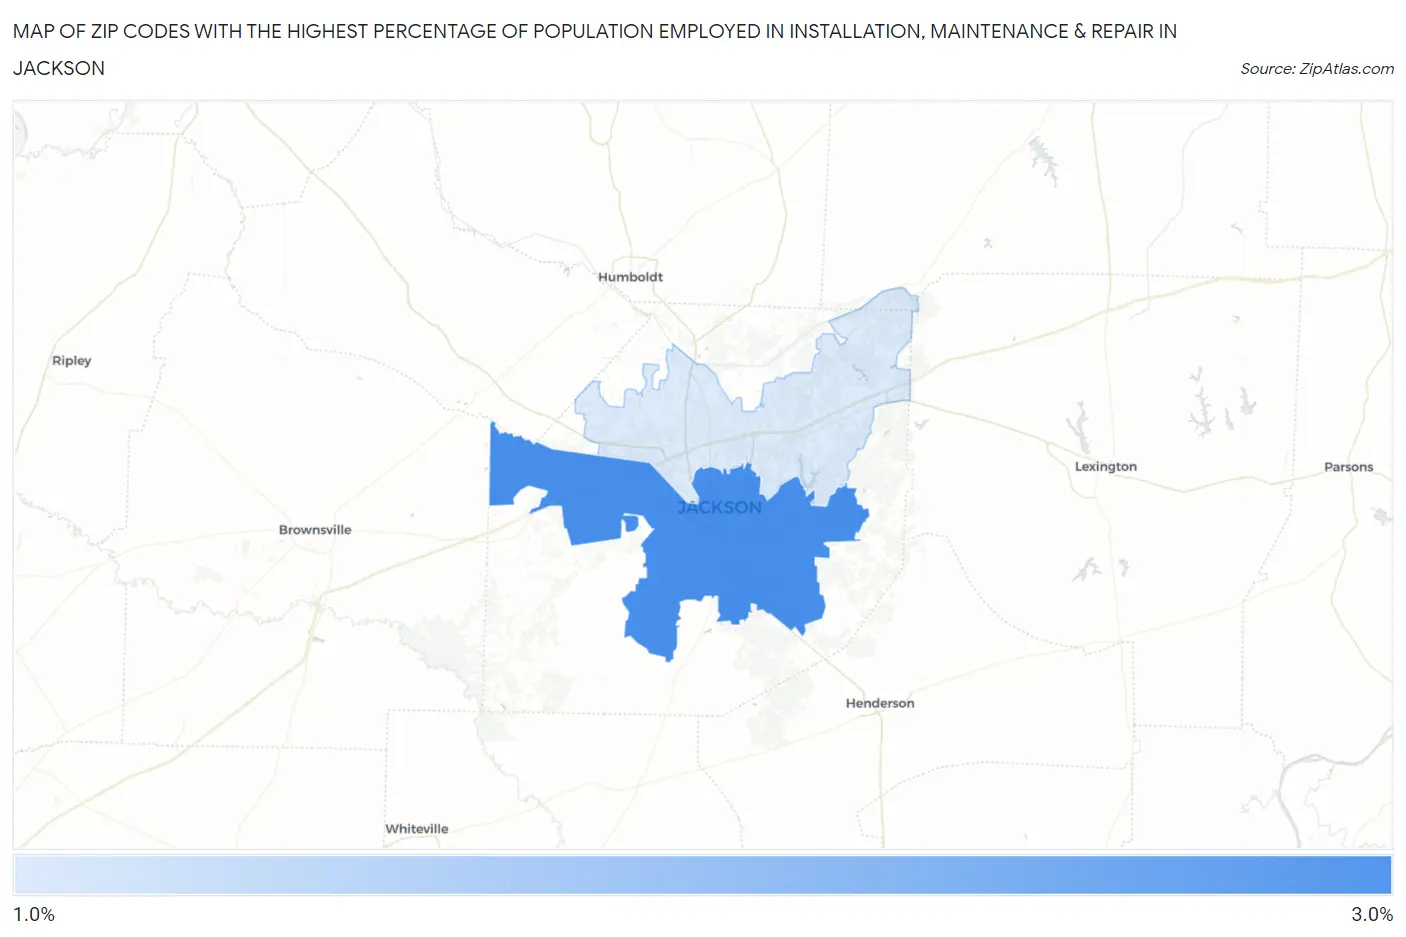
Map of Zip Codes with the Highest Percentage of Population Employed in Installation, Maintenance & Repair in Jackson
1.8%
2.7%
Zip Codes with the Highest Percentage of Population Employed in Installation, Maintenance & Repair in Jackson, TN
| Zip Code | % Employed | vs State | vs National | |
| 1. | 38301 | 2.7% | 3.3%(-0.571)#397 | 3.1%(-0.328)#18,316 |
| 2. | 38305 | 1.8% | 3.3%(-1.54)#477 | 3.1%(-1.29)#23,017 |
1
Common Questions
What are the Top Zip Codes with the Highest Percentage of Population Employed in Installation, Maintenance & Repair in Jackson, TN?
Top Zip Codes with the Highest Percentage of Population Employed in Installation, Maintenance & Repair in Jackson, TN are:
What zip code has the Highest Percentage of Population Employed in Installation, Maintenance & Repair in Jackson, TN?
38301 has the Highest Percentage of Population Employed in Installation, Maintenance & Repair in Jackson, TN with 2.7%.
What is the Percentage of Population Employed in Installation, Maintenance & Repair in Jackson, TN?
Percentage of Population Employed in Installation, Maintenance & Repair in Jackson is 1.4%.
What is the Percentage of Population Employed in Installation, Maintenance & Repair in Tennessee?
Percentage of Population Employed in Installation, Maintenance & Repair in Tennessee is 3.3%.
What is the Percentage of Population Employed in Installation, Maintenance & Repair in the United States?
Percentage of Population Employed in Installation, Maintenance & Repair in the United States is 3.1%.