Zip Codes with the Highest Percentage of Population Employed in Security & Protection in Charleston, SC
RELATED REPORTS & OPTIONS
Security & Protection
Charleston
Compare Zip Codes
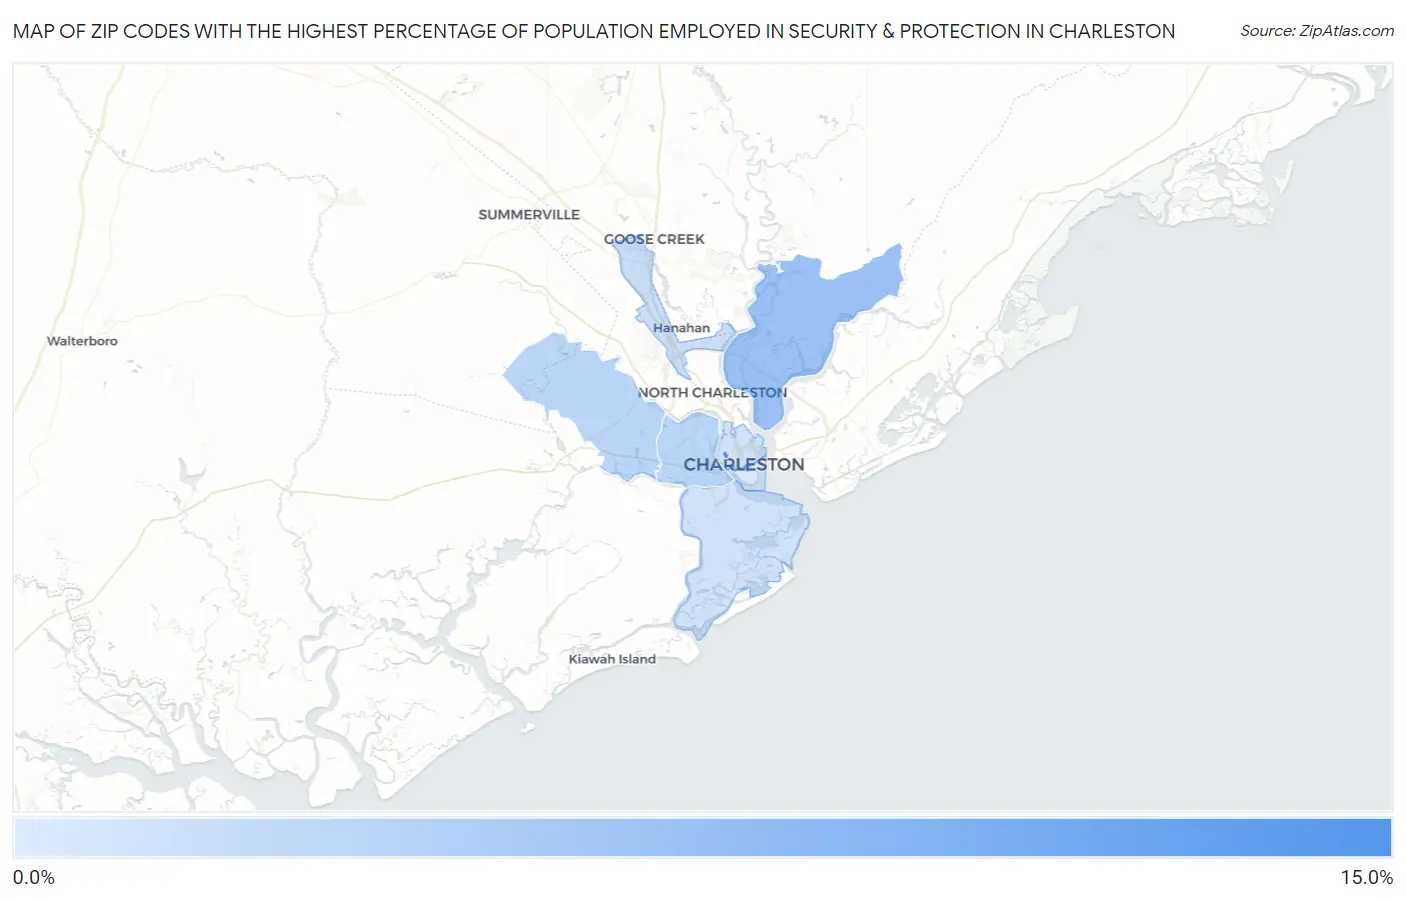
Map of Zip Codes with the Highest Percentage of Population Employed in Security & Protection in Charleston
0.14%
11.2%
Zip Codes with the Highest Percentage of Population Employed in Security & Protection in Charleston, SC
| Zip Code | % Employed | vs State | vs National | |
| 1. | 29409 | 11.2% | 2.1%(+9.06)#12 | 2.1%(+9.01)#630 |
| 2. | 29492 | 4.7% | 2.1%(+2.62)#56 | 2.1%(+2.57)#3,276 |
| 3. | 29414 | 2.6% | 2.1%(+0.511)#131 | 2.1%(+0.462)#8,956 |
| 4. | 29407 | 2.5% | 2.1%(+0.404)#144 | 2.1%(+0.356)#9,489 |
| 5. | 29406 | 1.4% | 2.1%(-0.666)#238 | 2.1%(-0.714)#16,707 |
| 6. | 29412 | 1.0% | 2.1%(-1.08)#284 | 2.1%(-1.13)#19,869 |
| 7. | 29403 | 0.87% | 2.1%(-1.23)#301 | 2.1%(-1.28)#20,981 |
| 8. | 29401 | 0.14% | 2.1%(-1.96)#348 | 2.1%(-2.01)#24,667 |
1
Common Questions
What are the Top 5 Zip Codes with the Highest Percentage of Population Employed in Security & Protection in Charleston, SC?
Top 5 Zip Codes with the Highest Percentage of Population Employed in Security & Protection in Charleston, SC are:
What zip code has the Highest Percentage of Population Employed in Security & Protection in Charleston, SC?
29409 has the Highest Percentage of Population Employed in Security & Protection in Charleston, SC with 11.2%.
What is the Percentage of Population Employed in Security & Protection in Charleston, SC?
Percentage of Population Employed in Security & Protection in Charleston is 1.8%.
What is the Percentage of Population Employed in Security & Protection in South Carolina?
Percentage of Population Employed in Security & Protection in South Carolina is 2.1%.
What is the Percentage of Population Employed in Security & Protection in the United States?
Percentage of Population Employed in Security & Protection in the United States is 2.1%.