Immigrants from Costa Rica Single Mother Poverty
COMPARE
Immigrants from Costa Rica
Select to Compare
Single Mother Poverty
Immigrants from Costa Rica Single Mother Poverty
29.2%
POVERTY | SINGLE MOTHERS
48.8/ 100
METRIC RATING
175th/ 347
METRIC RANK
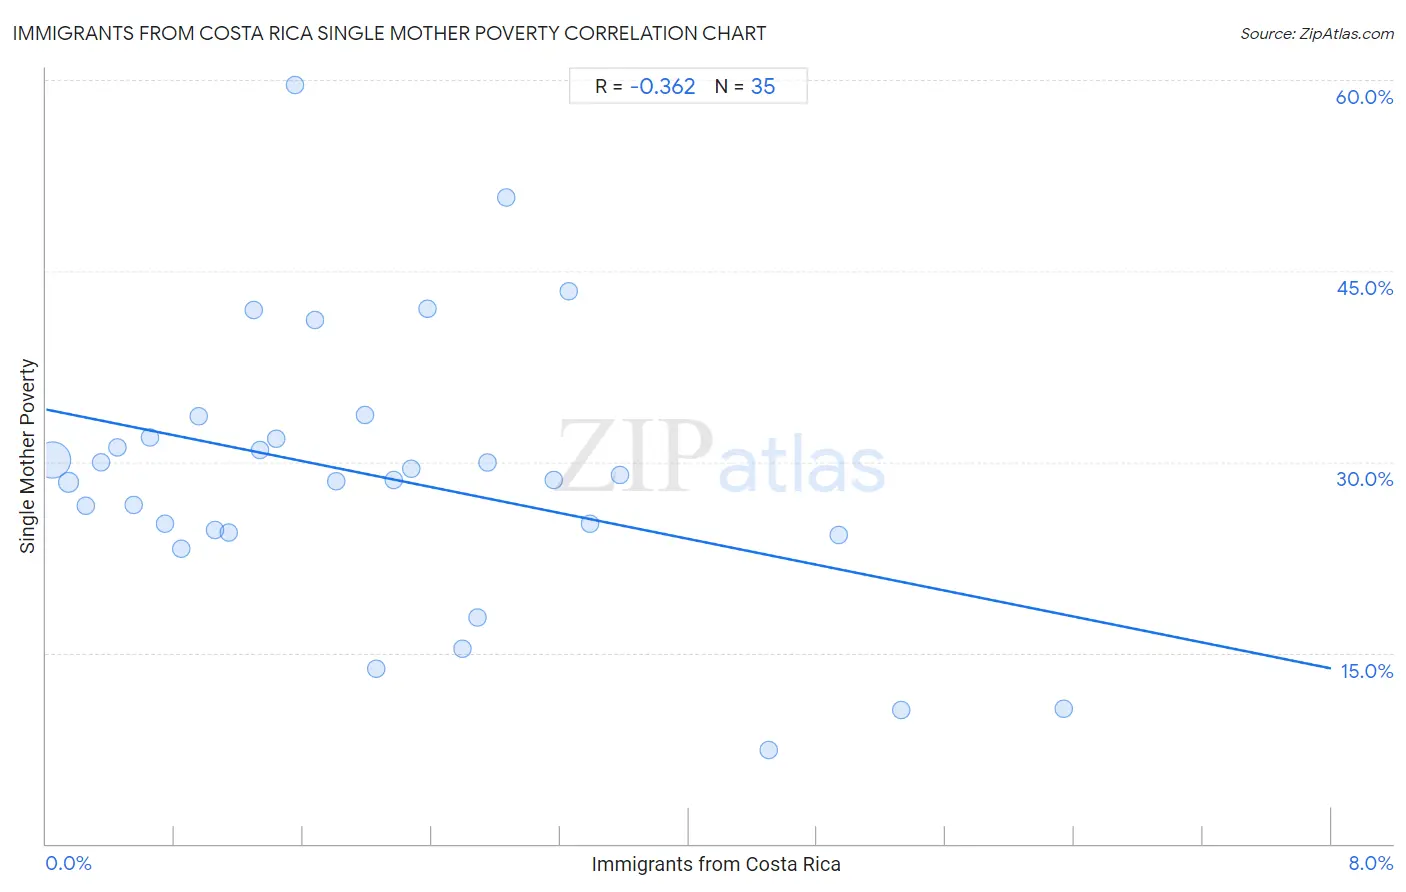
Immigrants from Costa Rica Single Mother Poverty Correlation Chart
The statistical analysis conducted on geographies consisting of 201,853,428 people shows a mild negative correlation between the proportion of Immigrants from Costa Rica and poverty level among single mothers in the United States with a correlation coefficient (R) of -0.362 and weighted average of 29.2%. On average, for every 1% (one percent) increase in Immigrants from Costa Rica within a typical geography, there is a decrease of 2.5% in poverty level among single mothers.
It is essential to understand that the correlation between the percentage of Immigrants from Costa Rica and poverty level among single mothers does not imply a direct cause-and-effect relationship. It remains uncertain whether the presence of Immigrants from Costa Rica influences an upward or downward trend in the level of poverty level among single mothers within an area, or if Immigrants from Costa Rica simply ended up residing in those areas with higher or lower levels of poverty level among single mothers due to other factors.
Demographics Similar to Immigrants from Costa Rica by Single Mother Poverty
In terms of single mother poverty, the demographic groups most similar to Immigrants from Costa Rica are Hawaiian (29.2%, a difference of 0.040%), Immigrants from Saudi Arabia (29.2%, a difference of 0.060%), British (29.2%, a difference of 0.090%), Immigrants from Bosnia and Herzegovina (29.2%, a difference of 0.17%), and Carpatho Rusyn (29.1%, a difference of 0.24%).
| Demographics | Rating | Rank | Single Mother Poverty |
| Europeans | 57.6 /100 | #168 | Average 29.1% |
| Immigrants from Uruguay | 57.2 /100 | #169 | Average 29.1% |
| New Zealanders | 55.1 /100 | #170 | Average 29.1% |
| Puget Sound Salish | 55.1 /100 | #171 | Average 29.1% |
| Carpatho Rusyns | 53.8 /100 | #172 | Average 29.1% |
| British | 50.6 /100 | #173 | Average 29.2% |
| Immigrants from Saudi Arabia | 50.0 /100 | #174 | Average 29.2% |
| Immigrants from Costa Rica | 48.8 /100 | #175 | Average 29.2% |
| Hawaiians | 47.8 /100 | #176 | Average 29.2% |
| Immigrants from Bosnia and Herzegovina | 45.1 /100 | #177 | Average 29.2% |
| South American Indians | 43.2 /100 | #178 | Average 29.3% |
| Immigrants from Uzbekistan | 42.6 /100 | #179 | Average 29.3% |
| Immigrants from Norway | 41.5 /100 | #180 | Average 29.3% |
| Canadians | 40.4 /100 | #181 | Average 29.3% |
| Immigrants from Eastern Africa | 38.5 /100 | #182 | Fair 29.3% |
Immigrants from Costa Rica Single Mother Poverty Correlation Summary
| Measurement | Immigrants from Costa Rica Data | Single Mother Poverty Data |
| Minimum | 0.037% | 7.4% |
| Maximum | 6.3% | 59.6% |
| Range | 6.3% | 52.2% |
| Mean | 2.1% | 28.9% |
| Median | 1.8% | 28.6% |
| Interquartile 25% (IQ1) | 0.84% | 24.4% |
| Interquartile 75% (IQ3) | 2.9% | 31.9% |
| Interquartile Range (IQR) | 2.0% | 7.4% |
| Standard Deviation (Sample) | 1.5% | 10.9% |
| Standard Deviation (Population) | 1.5% | 10.7% |
Correlation Details
| Immigrants from Costa Rica Percentile | Sample Size | Single Mother Poverty |
[ 0.0% - 0.5% ] 0.037% | 160,674,132 | 30.2% |
[ 0.0% - 0.5% ] 0.14% | 24,722,735 | 28.4% |
[ 0.0% - 0.5% ] 0.25% | 7,702,567 | 26.6% |
[ 0.0% - 0.5% ] 0.34% | 3,174,953 | 30.0% |
[ 0.0% - 0.5% ] 0.44% | 1,572,519 | 31.2% |
[ 0.5% - 1.0% ] 0.54% | 1,169,122 | 26.6% |
[ 0.5% - 1.0% ] 0.64% | 973,240 | 31.9% |
[ 0.5% - 1.0% ] 0.74% | 382,047 | 25.2% |
[ 0.5% - 1.0% ] 0.84% | 347,659 | 23.2% |
[ 0.5% - 1.0% ] 0.95% | 198,413 | 33.6% |
[ 1.0% - 1.5% ] 1.05% | 218,054 | 24.6% |
[ 1.0% - 1.5% ] 1.13% | 111,618 | 24.4% |
[ 1.0% - 1.5% ] 1.29% | 171,184 | 42.0% |
[ 1.0% - 1.5% ] 1.33% | 55,449 | 30.9% |
[ 1.0% - 1.5% ] 1.43% | 35,761 | 31.8% |
[ 1.5% - 2.0% ] 1.55% | 4,075 | 59.6% |
[ 1.5% - 2.0% ] 1.67% | 69,225 | 41.1% |
[ 1.5% - 2.0% ] 1.81% | 28,521 | 28.5% |
[ 1.5% - 2.0% ] 1.98% | 52,938 | 33.7% |
[ 2.0% - 2.5% ] 2.05% | 6,186 | 13.8% |
[ 2.0% - 2.5% ] 2.17% | 21,040 | 28.6% |
[ 2.0% - 2.5% ] 2.27% | 9,676 | 29.4% |
[ 2.0% - 2.5% ] 2.38% | 8,457 | 42.0% |
[ 2.5% - 3.0% ] 2.59% | 24,281 | 15.3% |
[ 2.5% - 3.0% ] 2.69% | 1,973 | 17.7% |
[ 2.5% - 3.0% ] 2.74% | 45,949 | 30.0% |
[ 2.5% - 3.0% ] 2.86% | 16,939 | 50.8% |
[ 3.0% - 3.5% ] 3.16% | 728 | 28.6% |
[ 3.0% - 3.5% ] 3.25% | 18,890 | 43.4% |
[ 3.0% - 3.5% ] 3.39% | 5,226 | 25.2% |
[ 3.5% - 4.0% ] 3.58% | 923 | 29.0% |
[ 4.0% - 4.5% ] 4.50% | 734 | 7.4% |
[ 4.5% - 5.0% ] 4.94% | 1,519 | 24.2% |
[ 5.0% - 5.5% ] 5.32% | 14,789 | 10.5% |
[ 6.0% - 6.5% ] 6.33% | 11,906 | 10.6% |