Black/African American vs Immigrants from Oceania Single Mother Poverty
COMPARE
Black/African American
Immigrants from Oceania
Single Mother Poverty
Single Mother Poverty Comparison
Blacks/African Americans
Immigrants from Oceania
35.2%
SINGLE MOTHER POVERTY
0.0/ 100
METRIC RATING
322nd/ 347
METRIC RANK
28.7%
SINGLE MOTHER POVERTY
79.9/ 100
METRIC RATING
151st/ 347
METRIC RANK
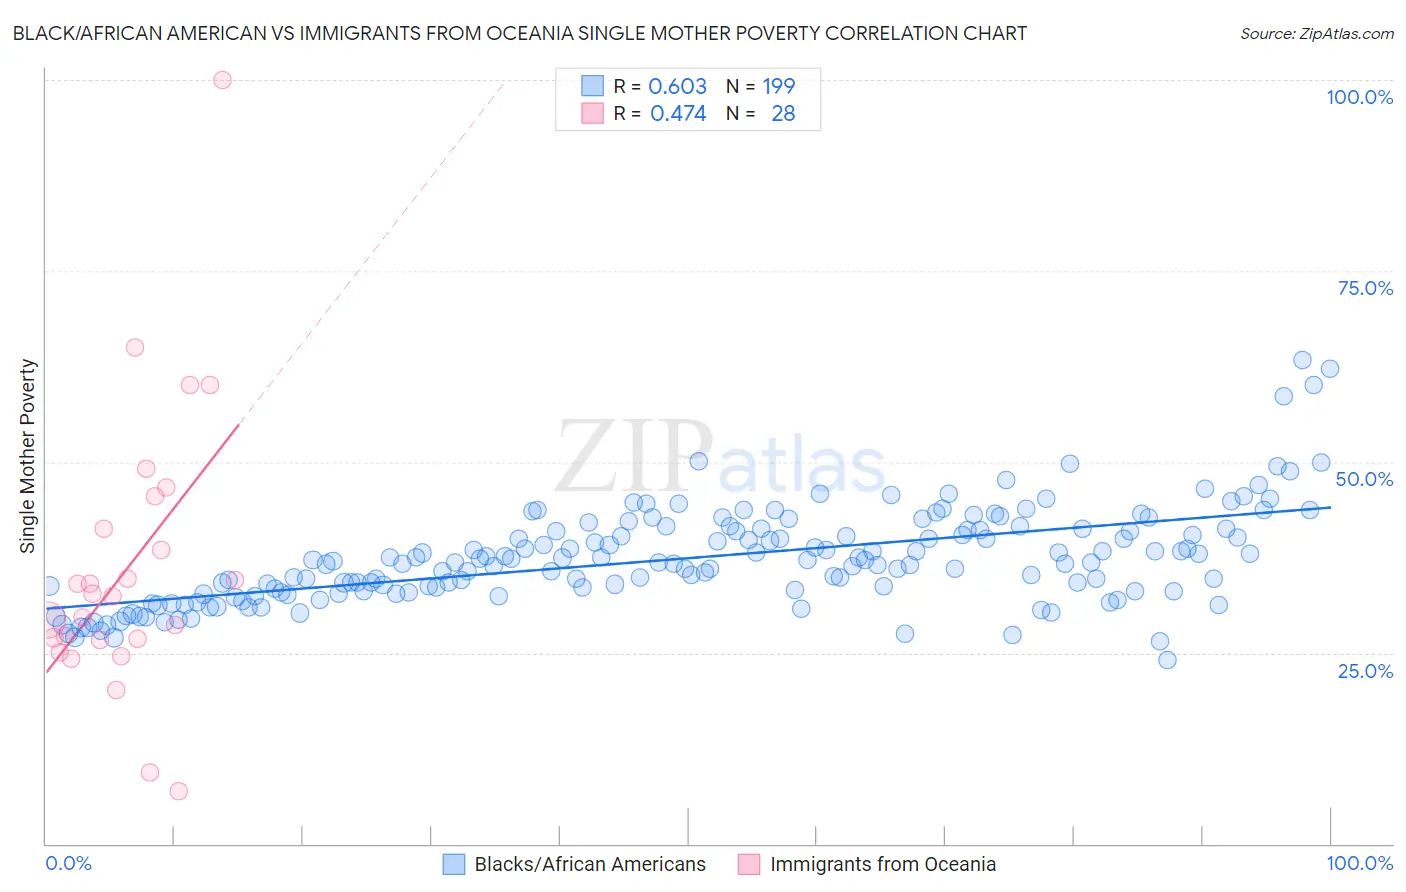
Black/African American vs Immigrants from Oceania Single Mother Poverty Correlation Chart
The statistical analysis conducted on geographies consisting of 541,579,434 people shows a significant positive correlation between the proportion of Blacks/African Americans and poverty level among single mothers in the United States with a correlation coefficient (R) of 0.603 and weighted average of 35.2%. Similarly, the statistical analysis conducted on geographies consisting of 299,142,558 people shows a moderate positive correlation between the proportion of Immigrants from Oceania and poverty level among single mothers in the United States with a correlation coefficient (R) of 0.474 and weighted average of 28.7%, a difference of 22.8%.
Single Mother Poverty Correlation Summary
| Measurement | Black/African American | Immigrants from Oceania |
| Minimum | 24.1% | 6.9% |
| Maximum | 63.3% | 100.0% |
| Range | 39.2% | 93.1% |
| Mean | 37.4% | 36.2% |
| Median | 36.8% | 32.5% |
| Interquartile 25% (IQ1) | 33.1% | 26.7% |
| Interquartile 75% (IQ3) | 41.1% | 43.3% |
| Interquartile Range (IQR) | 8.0% | 16.6% |
| Standard Deviation (Sample) | 6.3% | 18.5% |
| Standard Deviation (Population) | 6.3% | 18.1% |
Similar Demographics by Single Mother Poverty
Demographics Similar to Blacks/African Americans by Single Mother Poverty
In terms of single mother poverty, the demographic groups most similar to Blacks/African Americans are Paiute (35.1%, a difference of 0.20%), Kiowa (35.5%, a difference of 0.71%), Ottawa (35.5%, a difference of 0.92%), Iroquois (34.8%, a difference of 1.1%), and Chippewa (34.8%, a difference of 1.3%).
| Demographics | Rating | Rank | Single Mother Poverty |
| Hopi | 0.0 /100 | #315 | Tragic 34.5% |
| Dominicans | 0.0 /100 | #316 | Tragic 34.5% |
| Cherokee | 0.0 /100 | #317 | Tragic 34.5% |
| Immigrants | Honduras | 0.0 /100 | #318 | Tragic 34.7% |
| Chippewa | 0.0 /100 | #319 | Tragic 34.8% |
| Iroquois | 0.0 /100 | #320 | Tragic 34.8% |
| Paiute | 0.0 /100 | #321 | Tragic 35.1% |
| Blacks/African Americans | 0.0 /100 | #322 | Tragic 35.2% |
| Kiowa | 0.0 /100 | #323 | Tragic 35.5% |
| Ottawa | 0.0 /100 | #324 | Tragic 35.5% |
| Ute | 0.0 /100 | #325 | Tragic 35.7% |
| Seminole | 0.0 /100 | #326 | Tragic 35.8% |
| Yakama | 0.0 /100 | #327 | Tragic 36.4% |
| Choctaw | 0.0 /100 | #328 | Tragic 36.4% |
| Apache | 0.0 /100 | #329 | Tragic 36.6% |
Demographics Similar to Immigrants from Oceania by Single Mother Poverty
In terms of single mother poverty, the demographic groups most similar to Immigrants from Oceania are Austrian (28.7%, a difference of 0.070%), Northern European (28.6%, a difference of 0.14%), Slovene (28.8%, a difference of 0.25%), Serbian (28.6%, a difference of 0.44%), and Immigrants from Lebanon (28.6%, a difference of 0.46%).
| Demographics | Rating | Rank | Single Mother Poverty |
| Luxembourgers | 86.4 /100 | #144 | Excellent 28.5% |
| Immigrants | South America | 86.1 /100 | #145 | Excellent 28.5% |
| Immigrants | Denmark | 86.1 /100 | #146 | Excellent 28.5% |
| Immigrants | Lebanon | 85.3 /100 | #147 | Excellent 28.6% |
| Syrians | 85.3 /100 | #148 | Excellent 28.6% |
| Serbians | 85.0 /100 | #149 | Excellent 28.6% |
| Northern Europeans | 81.7 /100 | #150 | Excellent 28.6% |
| Immigrants | Oceania | 79.9 /100 | #151 | Good 28.7% |
| Austrians | 79.0 /100 | #152 | Good 28.7% |
| Slovenes | 76.4 /100 | #153 | Good 28.8% |
| Portuguese | 73.2 /100 | #154 | Good 28.8% |
| Ugandans | 71.7 /100 | #155 | Good 28.8% |
| Iraqis | 71.5 /100 | #156 | Good 28.8% |
| Immigrants | Western Europe | 71.1 /100 | #157 | Good 28.9% |
| Immigrants | Hungary | 70.6 /100 | #158 | Good 28.9% |