White/Caucasian vs Yugoslavian Unemployment Among Ages 55 to 59 years
COMPARE
White/Caucasian
Yugoslavian
Unemployment Among Ages 55 to 59 years
Unemployment Among Ages 55 to 59 years Comparison
Whites/Caucasians
Yugoslavians
4.7%
UNEMPLOYMENT AMONG AGES 55 TO 59 YEARS
90.7/ 100
METRIC RATING
119th/ 347
METRIC RANK
4.7%
UNEMPLOYMENT AMONG AGES 55 TO 59 YEARS
94.7/ 100
METRIC RATING
99th/ 347
METRIC RANK
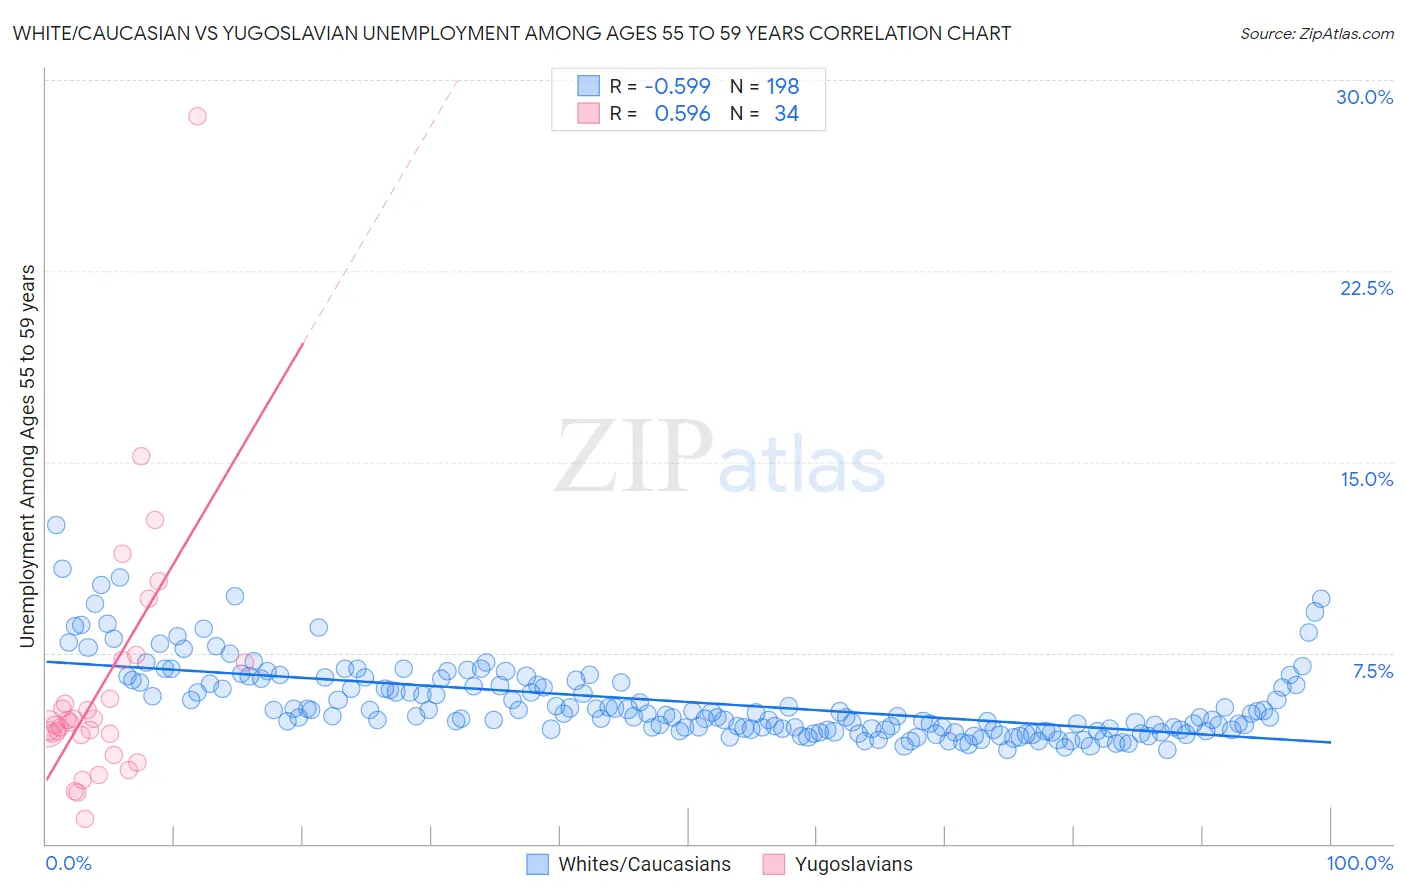
White/Caucasian vs Yugoslavian Unemployment Among Ages 55 to 59 years Correlation Chart
The statistical analysis conducted on geographies consisting of 492,133,782 people shows a substantial negative correlation between the proportion of Whites/Caucasians and unemployment rate among population between the ages 55 and 59 in the United States with a correlation coefficient (R) of -0.599 and weighted average of 4.7%. Similarly, the statistical analysis conducted on geographies consisting of 270,151,356 people shows a substantial positive correlation between the proportion of Yugoslavians and unemployment rate among population between the ages 55 and 59 in the United States with a correlation coefficient (R) of 0.596 and weighted average of 4.7%, a difference of 0.64%.
Unemployment Among Ages 55 to 59 years Correlation Summary
| Measurement | White/Caucasian | Yugoslavian |
| Minimum | 3.7% | 0.97% |
| Maximum | 12.5% | 28.6% |
| Range | 8.8% | 27.6% |
| Mean | 5.6% | 6.2% |
| Median | 5.1% | 4.7% |
| Interquartile 25% (IQ1) | 4.5% | 4.3% |
| Interquartile 75% (IQ3) | 6.3% | 7.1% |
| Interquartile Range (IQR) | 1.9% | 2.8% |
| Standard Deviation (Sample) | 1.5% | 5.0% |
| Standard Deviation (Population) | 1.5% | 5.0% |
Demographics Similar to Whites/Caucasians and Yugoslavians by Unemployment Among Ages 55 to 59 years
In terms of unemployment among ages 55 to 59 years, the demographic groups most similar to Whites/Caucasians are Immigrants from Chile (4.7%, a difference of 0.0%), Turkish (4.7%, a difference of 0.020%), Asian (4.7%, a difference of 0.020%), South American Indian (4.7%, a difference of 0.030%), and Bangladeshi (4.7%, a difference of 0.080%). Similarly, the demographic groups most similar to Yugoslavians are Serbian (4.7%, a difference of 0.070%), Celtic (4.7%, a difference of 0.090%), Canadian (4.7%, a difference of 0.13%), Immigrants from Oceania (4.7%, a difference of 0.13%), and Immigrants from Turkey (4.7%, a difference of 0.15%).
| Demographics | Rating | Rank | Unemployment Among Ages 55 to 59 years |
| Yugoslavians | 94.7 /100 | #99 | Exceptional 4.7% |
| Serbians | 94.4 /100 | #100 | Exceptional 4.7% |
| Celtics | 94.3 /100 | #101 | Exceptional 4.7% |
| Canadians | 94.1 /100 | #102 | Exceptional 4.7% |
| Immigrants | Oceania | 94.0 /100 | #103 | Exceptional 4.7% |
| Immigrants | Turkey | 93.9 /100 | #104 | Exceptional 4.7% |
| Immigrants | North America | 93.9 /100 | #105 | Exceptional 4.7% |
| Immigrants | Laos | 93.9 /100 | #106 | Exceptional 4.7% |
| Immigrants | Egypt | 93.5 /100 | #107 | Exceptional 4.7% |
| French | 93.3 /100 | #108 | Exceptional 4.7% |
| Chileans | 93.2 /100 | #109 | Exceptional 4.7% |
| Egyptians | 92.9 /100 | #110 | Exceptional 4.7% |
| Austrians | 92.4 /100 | #111 | Exceptional 4.7% |
| Afghans | 92.1 /100 | #112 | Exceptional 4.7% |
| Immigrants | Spain | 91.4 /100 | #113 | Exceptional 4.7% |
| Bangladeshis | 91.3 /100 | #114 | Exceptional 4.7% |
| South American Indians | 90.9 /100 | #115 | Exceptional 4.7% |
| Turks | 90.9 /100 | #116 | Exceptional 4.7% |
| Asians | 90.8 /100 | #117 | Exceptional 4.7% |
| Immigrants | Chile | 90.7 /100 | #118 | Exceptional 4.7% |
| Whites/Caucasians | 90.7 /100 | #119 | Exceptional 4.7% |