Thai vs Immigrants from Czechoslovakia Male Poverty
COMPARE
Thai
Immigrants from Czechoslovakia
Male Poverty
Male Poverty Comparison
Thais
Immigrants from Czechoslovakia
8.7%
MALE POVERTY
100.0/ 100
METRIC RATING
3rd/ 347
METRIC RANK
10.0%
MALE POVERTY
98.6/ 100
METRIC RATING
53rd/ 347
METRIC RANK
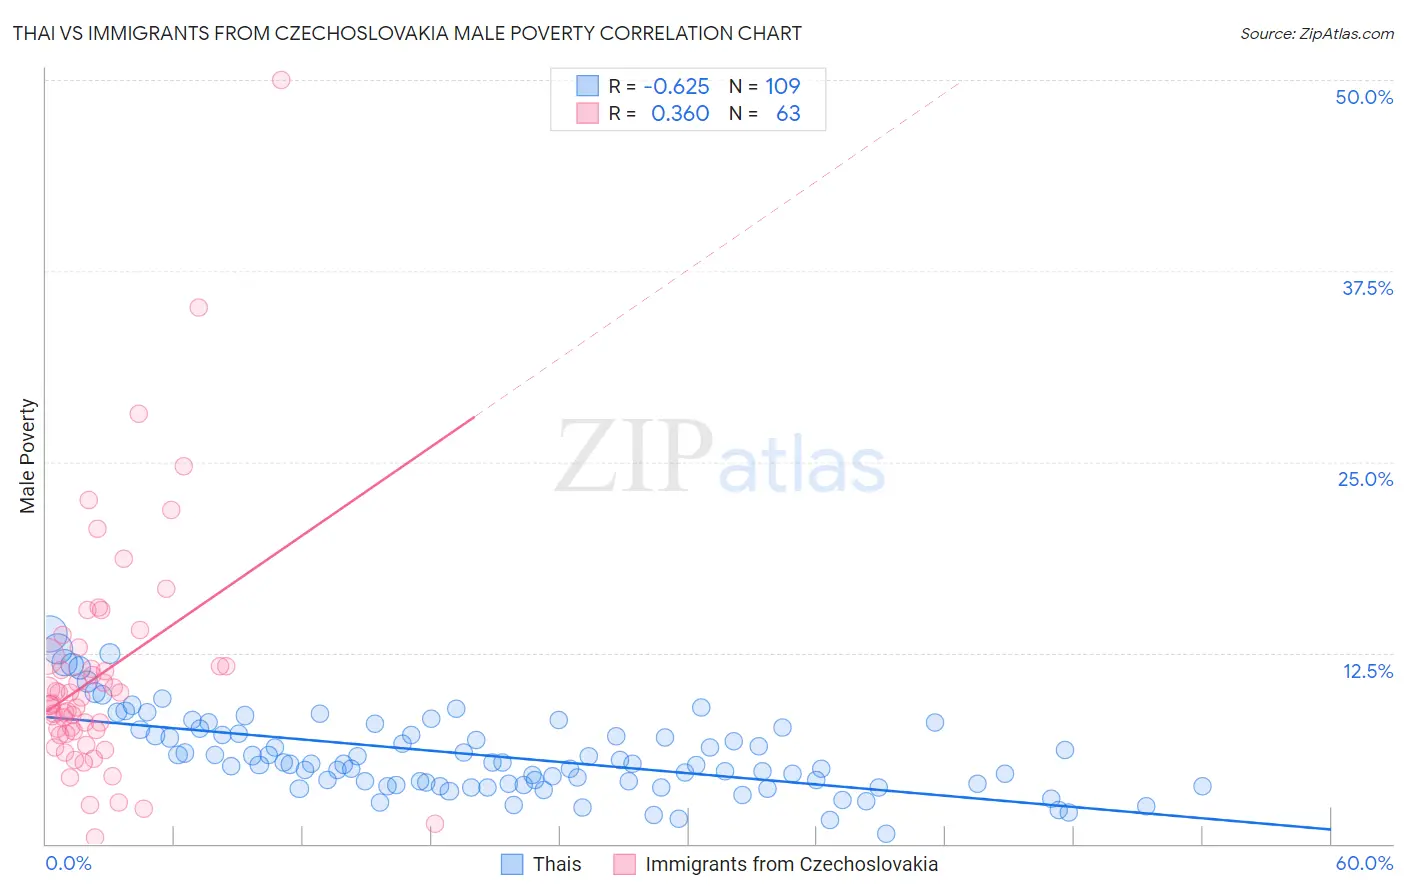
Thai vs Immigrants from Czechoslovakia Male Poverty Correlation Chart
The statistical analysis conducted on geographies consisting of 475,089,189 people shows a significant negative correlation between the proportion of Thais and poverty level among males in the United States with a correlation coefficient (R) of -0.625 and weighted average of 8.7%. Similarly, the statistical analysis conducted on geographies consisting of 195,424,226 people shows a mild positive correlation between the proportion of Immigrants from Czechoslovakia and poverty level among males in the United States with a correlation coefficient (R) of 0.360 and weighted average of 10.0%, a difference of 15.2%.
Male Poverty Correlation Summary
| Measurement | Thai | Immigrants from Czechoslovakia |
| Minimum | 0.62% | 0.44% |
| Maximum | 13.7% | 50.0% |
| Range | 13.1% | 49.6% |
| Mean | 5.8% | 11.2% |
| Median | 5.2% | 9.2% |
| Interquartile 25% (IQ1) | 3.9% | 7.2% |
| Interquartile 75% (IQ3) | 7.3% | 12.2% |
| Interquartile Range (IQR) | 3.4% | 5.0% |
| Standard Deviation (Sample) | 2.6% | 8.0% |
| Standard Deviation (Population) | 2.6% | 7.9% |
Similar Demographics by Male Poverty
Demographics Similar to Thais by Male Poverty
In terms of male poverty, the demographic groups most similar to Thais are Chinese (8.7%, a difference of 0.080%), Immigrants from Taiwan (8.9%, a difference of 2.3%), Maltese (9.1%, a difference of 4.3%), Assyrian/Chaldean/Syriac (9.1%, a difference of 5.1%), and Immigrants from Ireland (9.1%, a difference of 5.1%).
| Demographics | Rating | Rank | Male Poverty |
| Immigrants | India | 100.0 /100 | #1 | Exceptional 8.2% |
| Chinese | 100.0 /100 | #2 | Exceptional 8.7% |
| Thais | 100.0 /100 | #3 | Exceptional 8.7% |
| Immigrants | Taiwan | 100.0 /100 | #4 | Exceptional 8.9% |
| Maltese | 100.0 /100 | #5 | Exceptional 9.1% |
| Assyrians/Chaldeans/Syriacs | 99.9 /100 | #6 | Exceptional 9.1% |
| Immigrants | Ireland | 99.9 /100 | #7 | Exceptional 9.1% |
| Filipinos | 99.9 /100 | #8 | Exceptional 9.2% |
| Immigrants | South Central Asia | 99.9 /100 | #9 | Exceptional 9.3% |
| Bulgarians | 99.9 /100 | #10 | Exceptional 9.3% |
| Bolivians | 99.9 /100 | #11 | Exceptional 9.4% |
| Immigrants | Bolivia | 99.9 /100 | #12 | Exceptional 9.4% |
| Immigrants | Lithuania | 99.9 /100 | #13 | Exceptional 9.4% |
| Immigrants | North Macedonia | 99.8 /100 | #14 | Exceptional 9.4% |
| Bhutanese | 99.8 /100 | #15 | Exceptional 9.5% |
Demographics Similar to Immigrants from Czechoslovakia by Male Poverty
In terms of male poverty, the demographic groups most similar to Immigrants from Czechoslovakia are Asian (10.0%, a difference of 0.070%), Immigrants from Croatia (10.0%, a difference of 0.16%), Immigrants from Philippines (10.0%, a difference of 0.27%), Immigrants from Austria (10.0%, a difference of 0.28%), and Slovene (10.0%, a difference of 0.32%).
| Demographics | Rating | Rank | Male Poverty |
| Turks | 98.9 /100 | #46 | Exceptional 10.0% |
| Immigrants | Singapore | 98.8 /100 | #47 | Exceptional 10.0% |
| Immigrants | Japan | 98.8 /100 | #48 | Exceptional 10.0% |
| Slovenes | 98.8 /100 | #49 | Exceptional 10.0% |
| Immigrants | Philippines | 98.7 /100 | #50 | Exceptional 10.0% |
| Immigrants | Croatia | 98.7 /100 | #51 | Exceptional 10.0% |
| Asians | 98.7 /100 | #52 | Exceptional 10.0% |
| Immigrants | Czechoslovakia | 98.6 /100 | #53 | Exceptional 10.0% |
| Immigrants | Austria | 98.5 /100 | #54 | Exceptional 10.0% |
| Germans | 98.3 /100 | #55 | Exceptional 10.1% |
| Immigrants | Bulgaria | 98.2 /100 | #56 | Exceptional 10.1% |
| Estonians | 98.1 /100 | #57 | Exceptional 10.1% |
| Scandinavians | 98.0 /100 | #58 | Exceptional 10.1% |
| Immigrants | Europe | 97.9 /100 | #59 | Exceptional 10.1% |
| Ukrainians | 97.9 /100 | #60 | Exceptional 10.1% |