Thai vs Puget Sound Salish Male Poverty
COMPARE
Thai
Puget Sound Salish
Male Poverty
Male Poverty Comparison
Thais
Puget Sound Salish
8.7%
MALE POVERTY
100.0/ 100
METRIC RATING
3rd/ 347
METRIC RANK
10.7%
MALE POVERTY
84.3/ 100
METRIC RATING
127th/ 347
METRIC RANK
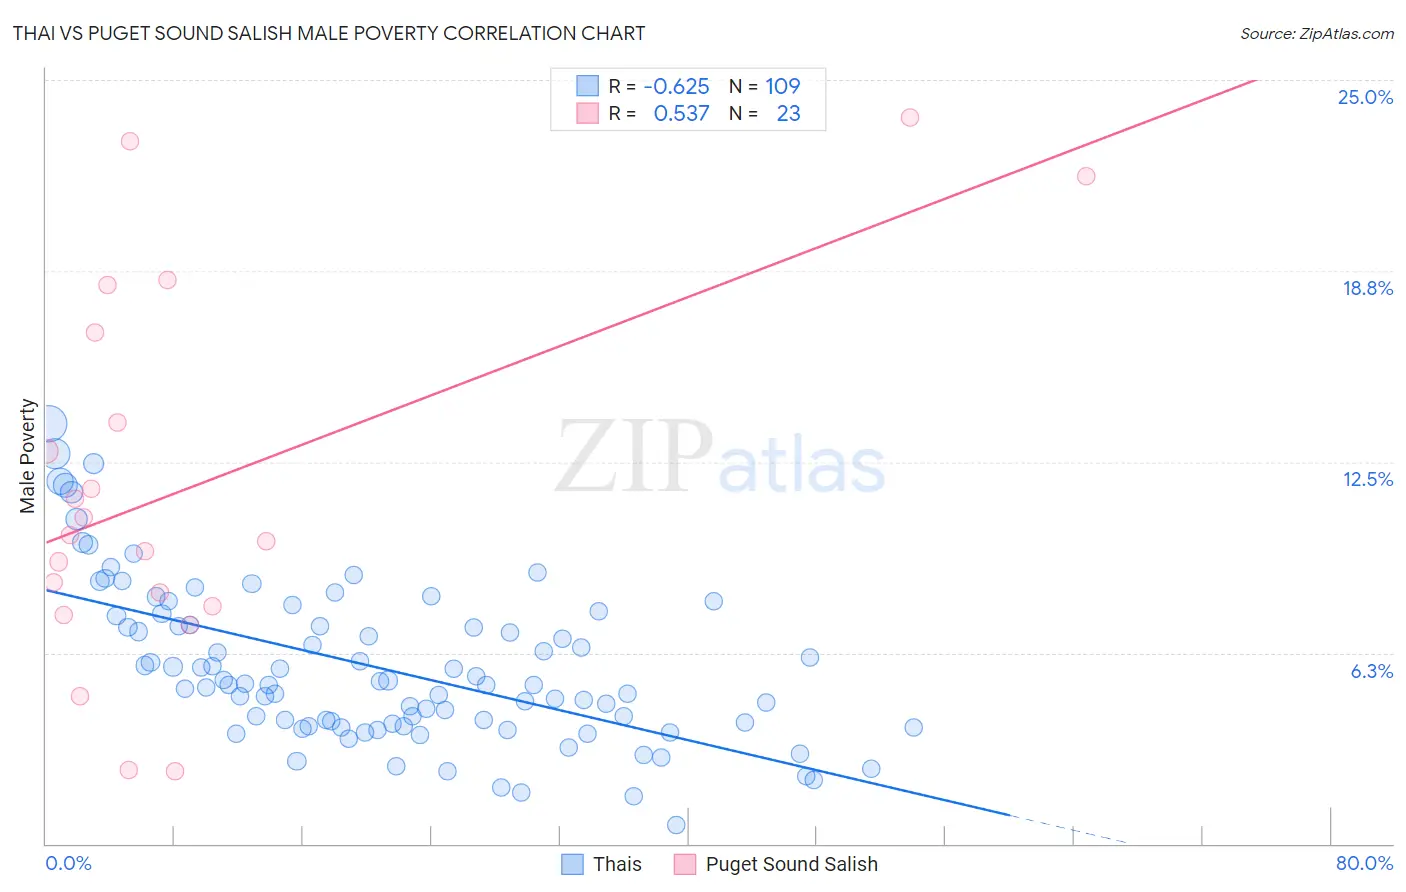
Thai vs Puget Sound Salish Male Poverty Correlation Chart
The statistical analysis conducted on geographies consisting of 475,089,189 people shows a significant negative correlation between the proportion of Thais and poverty level among males in the United States with a correlation coefficient (R) of -0.625 and weighted average of 8.7%. Similarly, the statistical analysis conducted on geographies consisting of 46,147,564 people shows a substantial positive correlation between the proportion of Puget Sound Salish and poverty level among males in the United States with a correlation coefficient (R) of 0.537 and weighted average of 10.7%, a difference of 23.4%.
Male Poverty Correlation Summary
| Measurement | Thai | Puget Sound Salish |
| Minimum | 0.62% | 2.4% |
| Maximum | 13.7% | 23.8% |
| Range | 13.1% | 21.4% |
| Mean | 5.8% | 11.7% |
| Median | 5.2% | 10.1% |
| Interquartile 25% (IQ1) | 3.9% | 7.8% |
| Interquartile 75% (IQ3) | 7.3% | 16.7% |
| Interquartile Range (IQR) | 3.4% | 9.0% |
| Standard Deviation (Sample) | 2.6% | 6.1% |
| Standard Deviation (Population) | 2.6% | 5.9% |
Similar Demographics by Male Poverty
Demographics Similar to Thais by Male Poverty
In terms of male poverty, the demographic groups most similar to Thais are Chinese (8.7%, a difference of 0.080%), Immigrants from Taiwan (8.9%, a difference of 2.3%), Maltese (9.1%, a difference of 4.3%), Assyrian/Chaldean/Syriac (9.1%, a difference of 5.1%), and Immigrants from Ireland (9.1%, a difference of 5.1%).
| Demographics | Rating | Rank | Male Poverty |
| Immigrants | India | 100.0 /100 | #1 | Exceptional 8.2% |
| Chinese | 100.0 /100 | #2 | Exceptional 8.7% |
| Thais | 100.0 /100 | #3 | Exceptional 8.7% |
| Immigrants | Taiwan | 100.0 /100 | #4 | Exceptional 8.9% |
| Maltese | 100.0 /100 | #5 | Exceptional 9.1% |
| Assyrians/Chaldeans/Syriacs | 99.9 /100 | #6 | Exceptional 9.1% |
| Immigrants | Ireland | 99.9 /100 | #7 | Exceptional 9.1% |
| Filipinos | 99.9 /100 | #8 | Exceptional 9.2% |
| Immigrants | South Central Asia | 99.9 /100 | #9 | Exceptional 9.3% |
| Bulgarians | 99.9 /100 | #10 | Exceptional 9.3% |
| Bolivians | 99.9 /100 | #11 | Exceptional 9.4% |
| Immigrants | Bolivia | 99.9 /100 | #12 | Exceptional 9.4% |
| Immigrants | Lithuania | 99.9 /100 | #13 | Exceptional 9.4% |
| Immigrants | North Macedonia | 99.8 /100 | #14 | Exceptional 9.4% |
| Bhutanese | 99.8 /100 | #15 | Exceptional 9.5% |
Demographics Similar to Puget Sound Salish by Male Poverty
In terms of male poverty, the demographic groups most similar to Puget Sound Salish are Immigrants from Ukraine (10.7%, a difference of 0.0%), Immigrants from Western Europe (10.7%, a difference of 0.020%), Immigrants from Peru (10.7%, a difference of 0.030%), Chilean (10.7%, a difference of 0.070%), and Immigrants from Belarus (10.7%, a difference of 0.18%).
| Demographics | Rating | Rank | Male Poverty |
| Immigrants | China | 87.1 /100 | #120 | Excellent 10.7% |
| Peruvians | 87.1 /100 | #121 | Excellent 10.7% |
| Native Hawaiians | 87.0 /100 | #122 | Excellent 10.7% |
| South Africans | 86.8 /100 | #123 | Excellent 10.7% |
| French | 86.7 /100 | #124 | Excellent 10.7% |
| Immigrants | Norway | 86.0 /100 | #125 | Excellent 10.7% |
| Immigrants | Ukraine | 84.3 /100 | #126 | Excellent 10.7% |
| Puget Sound Salish | 84.3 /100 | #127 | Excellent 10.7% |
| Immigrants | Western Europe | 84.2 /100 | #128 | Excellent 10.7% |
| Immigrants | Peru | 84.1 /100 | #129 | Excellent 10.7% |
| Chileans | 83.9 /100 | #130 | Excellent 10.7% |
| Immigrants | Belarus | 83.3 /100 | #131 | Excellent 10.7% |
| Immigrants | Vietnam | 83.0 /100 | #132 | Excellent 10.8% |
| Pakistanis | 83.0 /100 | #133 | Excellent 10.8% |
| New Zealanders | 82.9 /100 | #134 | Excellent 10.8% |